As part of our commitment to safe, clean, enjoyable creeks and rivers, the San Antonio River Authority (River Authority) has created the San Antonio River Basin Report Card. Learn more about the river basin report card and how each person can help improve the health of the river basin!
2022 Report Card
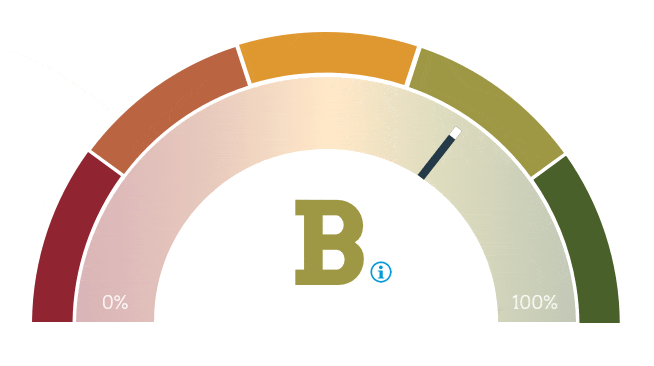
The overall grade for the 2022 San Antonio River Basin Report Card is B, which is the same as as the last two years. This grade is the average of twelve individual indicator grades. The overall score for this year is 1-point higher than last year; however, the slight increase in score is not enough to raise the grade. This grade is the average of twelve individual indicator grades, which are explained in greater detail below.
Additional Noteworthy Information
It is a complicated task coming up with a river basin report card. The challenge is determining the metrics that have viable data, are simple to explain, and are repeatable year after year in order to show trends. Then there are the important issues that need to be included but have not been measured for one reason or another – or maybe they are one-off occurrences that are significant enough to mention. There certainly were some important issues that unfolded during our Fiscal Year 2021-22 (i.e. July 1, 2021 to June 30, 2022). For that reason, we added this final section to the San Antonio River Basin Report Card to capture the top noteworthy bits of information that we did not apply a grade to, but nevertheless, believe are important to mention.
MANAGEMENT OF INVASIVE SPECIES
River Authority staff are constantly on the lookout for non-native invasive species and will take appropriate actions to help control their spread. For example, when the San Antonio River Walk is drained for maintenance – which happens every few years – River Authority staff typically find and remove two non-native invasive fish species: Plecostomus and tilapia. The Plecostomus is a suckermouth catfish, which is a tropical fish from the armored catfish family. Tilapia is a fish native to Africa and is part of the cichlid family. These two non-native invasive fish species have long been a nuisance in the River Walk and other sections of the San Antonio River.
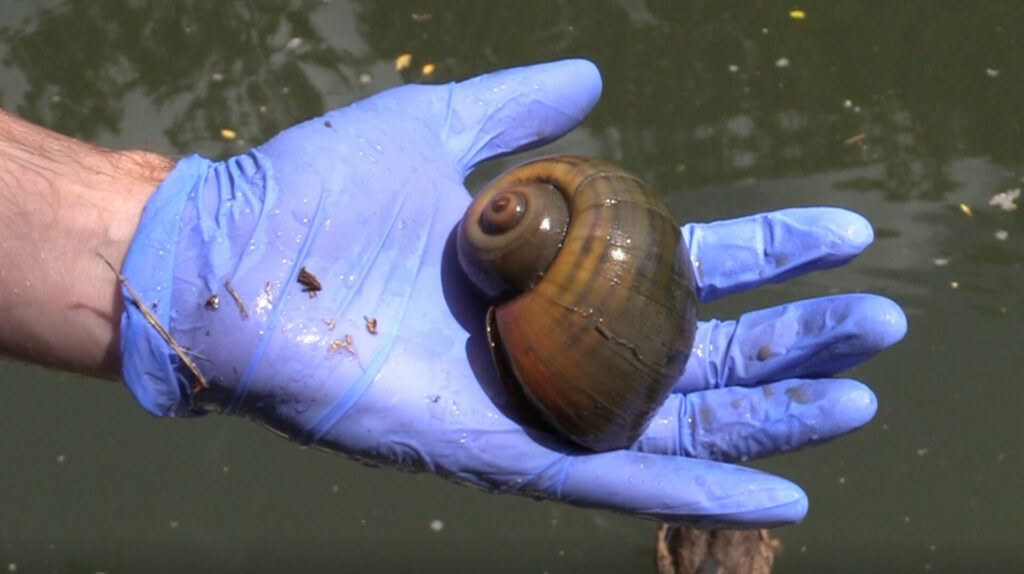
Unfortunately, a new non-native invasive species, the Apple Snail, was discovered in the River Walk in October 2019. A native of South America, these snails can grow to 6 inches and their presence is often indicated by the bright pink egg sacks that can contain thousands of individual eggs. Apple Snails continue to be a threat and River Authority staff and River Warrior volunteers regularly remove these invaders. Please sign up to be a River Warrior if you’re interested in joining this fight.
How did the Apple Snail get into the San Antonio River, you may ask? These aquatic species are found in many home aquariums. So, it is most likely that these non-native invasive species, similar to the Plecostomus, have been introduced into our basin by people who have illegally dumped their fish tanks into the river. Citizens are encouraged to help stop the spread of non-native invasive aquatic species by never dumping aquarium contents in a Texas river, lake, or natural body of water.
There are other non-native invasive species to consider as well. Zebra mussels, for example, can multiply rapidly, and infested streams and lakes have reported colonies of zebra mussels taking over habitats and nutrients from native fish and mussel colonies. This past year, zebra mussels were identified in Medina Lake, which is within the San Antonio River Basin. Zebra mussels can interfere with recreation and wreak financial havoc on infrastructure, so there is a large concern now that this invasive species is in the basin. Learn how you can slow the spread of zebra mussels.
You can minimize the impact of non-native invasive bird species by not feeding the wildlife and you can help stop the spread of non-native invasive plant species by only planting native species around your home. Community members who recreate along River Authority parks and trails can also help to stop the spread of non-native species by reporting any new sightings of non-native invasive species to the River Authority’s Environmental Investigations Team. To learn more about how to stop the spread of non-native invasive species, please visit texasinvasives.org.
NEW RIVER AUTHORITY PARKS
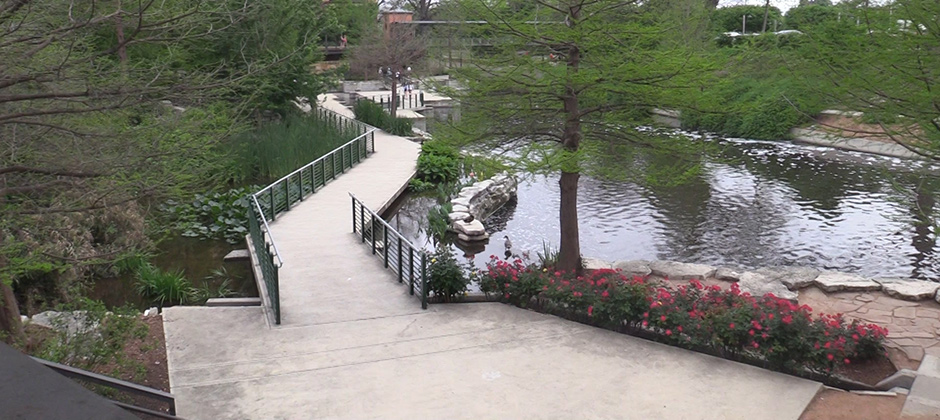
The River Authority firmly supports the health and quality of life benefits of nature-based recreation. Over the past decade, the River Authority has added nature-based recreational activities throughout the basin including hike and bike trails, paddling trails, picnic and camping areas, playgrounds, fishing, birdwatching, and even disc golf courses. These river-based recreational resources have attracted thousands of users to bask in the beauty and enjoyment of nature, while the River Authority is well-aware of the benefits of nature-based parks, science is demonstrating that being in nature and nature sounds are healing.
A park usage score is one of the metrics of this river basin report card. Last fiscal year, the River Authority opened the Escondido Creek Parkway, expanded the Goliad Paddling Trail, and added the North American Friendship Garden to Confluence Park.
WESTSIDE CREEKS RESTORATION PROJECT TAKES LARGE STEP FORWARD
Shortly after President Biden took office in January 2021, he moved quickly to place environmental justice at center of sweeping climate plan. The Administration’s move to focus on environmental justice issues helped advance the Westside Creeks Restoration Project as the project was recognized in the President’s Budget in June 2021. Read about the upcoming plans for the Westside Creek Restoration project under News Releases.
2021 Report Card
The overall grade for the 2021 San Antonio River Basin Report Card is B. This grade is the average of twelve individual indicator grades, which are explained in greater detail below.
Additional Noteworthy Information
It is a complicated task coming up with a river basin report card. The challenge is determining the metrics that have viable data, are simple to explain, and are repeatable year after year in order to show trends. Then there are the important issues that need to be included but have not been measured for one reason or another – or maybe they are one-off occurrences that are significant enough to mention. There certainly were some important issues that unfolded during our Fiscal Year 2020-21 (i.e. July 1, 2020 to June 30, 2021). For that reason, we added this final section to the San Antonio River Basin Report Card to capture the top noteworthy bits of information that we did not apply a grade to, but nevertheless, believe are important to mention.
NEW GENERAL MANAGER
While the global pandemic brought about by the COVID-19 virus remained a significant story of the 2020-21 Fiscal Year, another important story took place at the River Authority. Suzanne Scott, the River Authority’s long-time general manager retired in October 2020. Suzanne gave final reflections of a public servant and her time at the River Authority prior to her last day.
The River Authority’s Board of Directors undertook a national search for a new general manager and appointed Derek Boese in March 2021. You can learn more about Derek by reading his first blog as the River Authority’s new general manager.
WASTEWATER TREATMENT PLANT EXPANSIONS
Wastewater utilities provide an incredibly important service to communities that often goes under-appreciated. Simply put, the average citizen has come to expect and rely on good wastewater treatment services without having to put much thought into its value. Wastewater treatment plants (WWTP) not only provide a vital health related service to the community, by treating wastewater to a high-quality effluent, WWTPs also provide a significant water quality and water quantity service to area creeks and rivers.
The River Authority Utilities owns, operates, and maintains several WWTPs and collection systems. The operators and staff continuously attend related accredited sewer and water courses to improve their job performance and maintain or upgrade their state certification status. The plants’ operators are certified by Texas Commission on Environmental Quality (TCEQ).
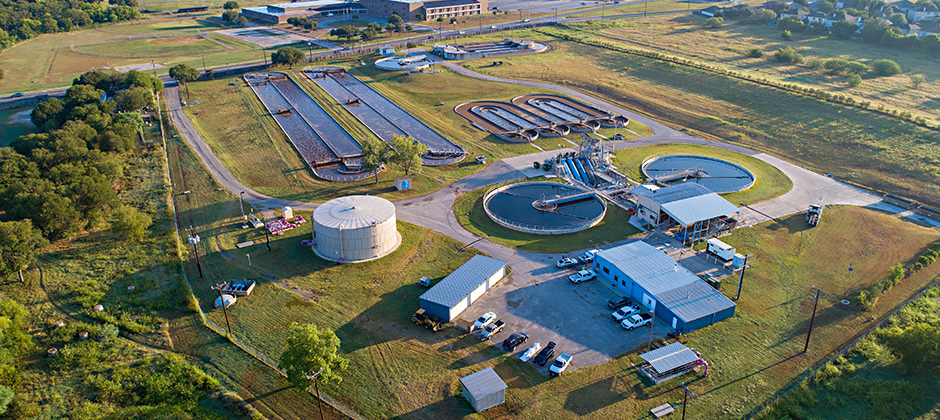
Given the significance of WWTPs, we felt it necessary to include in this year’s basin report card information about two WWTP expansions. Plans began last year for the expansion of the Salitrillo WWTP to 7.33 MGD to accommodate expected development in the area. This will be a progressive design build project and is anticipated to be complete in 2022. The estimated project cost will be $25 million. Planning has also begun on the expansion of the Martinez IV WWTP, which was first opened in April 2019. Due to the unexpected rapidly developing service area, this WWTP is already near its capacity and needs an expansion to 1.5 to 2.0 MGD. The design is projected to be completed in 2022 at a total cost of $10 million.
In addition to the WWTP expansions, during this past fiscal year, the River Authority announced on August 17, 2020 that a Utilities Development Advisory Committee (UDAC) was created with the goal to promote sustainable development within the agency’s water and wastewater service areas.
2020 HURRICANE SEASON
Texas had its share of hurricanes in 2020 with a number of named storms hitting the state, including Hanna and Laura.
MANAGEMENT OF INVASIVE SPECIES
River Authority staff are constantly on the lookout for non-native invasive species and will take appropriate actions to help control their spread. For example, when the San Antonio River Walk is drained for maintenance – which happens every few years – River Authority staff typically find and remove two non-native invasive fish species: Plecostomus and tilapia. The Plecostomus is a suckermouth catfish, which is a tropical fish from the armored catfish family. Tilapia is a fish native to Africa and is part of the cichlid family. These two non-native invasive fish species have long been a nuisance in the River Walk and other sections of the San Antonio River.

Unfortunately, a new non-native invasive species, the Apple Snail, was discovered in the River Walk in October 2019. A native of South America, these snails can grow to 6 inches and their presence is often indicated by the bright pink egg sacks that can contain thousands of individual eggs. Apple Snails continue to be a threat and River Authority staff and River Warrior volunteers regularly remove these invaders. Please sign up to be a River Warrior if you’re interested in joining this fight.
How did the Apple Snail get into the San Antonio River, you may ask? These aquatic species are found in many home aquariums. So, it is most likely that these non-native invasive species, similar to the Plecostomus, have been introduced into our basin by people who have illegally dumped their fish tanks into the river. Citizens are encouraged to help stop the spread of non-native invasive aquatic species by never dumping aquarium contents in a Texas river, lake, or natural body of water.
There are other non-native invasive species to consider as well. Zebra mussels, for example, can multiply rapidly, and infested streams and lakes have reported colonies of zebra mussels taking over habitats and nutrients from native fish and mussel colonies. This past year, zebra mussels were identified in Medina Lake, which is within the San Antonio River Basin. Zebra mussels can interfere with recreation and wreak financial havoc on infrastructure, so there is a large concern now that this invasive species is in the basin. Learn how you can slow the spread of zebra mussels.
You can minimize the impact of non-native invasive bird species by not feeding the wildlife and you can help stop the spread of non-native invasive plant species by only planting native species around your home. Community members who recreate along River Authority parks and trails can also help to stop the spread of non-native species by reporting any new sightings of non-native invasive species to the River Authority’s Environmental Investigations Team. To learn more about how to stop the spread of non-native invasive species, please visit texasinvasives.org.
HUMAN IMPACTS ON THE ENVIRONMENT AND POLLUTION
An interesting study released in early 2021 indicated that very few of world’s rivers are undamaged by humanity and another study released prior to Earth Day in April 2021 showed how researchers are uncovering a plastic cycle in the atmosphere.
NEW RIVER AUTHORITY PARKS
The River Authority firmly supports the health and quality of life benefits of nature-based recreation. Over the past decade, the River Authority has added nature-based recreational activities throughout the basin including hike and bike trails, paddling trails, picnic and camping areas, playgrounds, fishing, birdwatching, and even disc golf courses. These river-based recreational resources have attracted thousands of users to bask in the beauty and enjoyment of nature, while the River Authority is well-aware of the benefits of nature-based parks, science is demonstrating that being in nature and nature sounds are healing.
A park usage score is one of the metrics of this river basin report card. During this past fiscal year, the River Authority opened the Escondido Creek Parkway, expanded the Goliad Paddling Trail, and added the North American Friendship Garden to Confluence Park.
WESTSIDE CREEKS RESTORATION PROJECT TAKES LARGE STEP FORWARD
Shortly after President Biden took office in January 2021, he moved quickly to place environmental justice at center of sweeping climate plan. The Administration’s move to focus on environmental justice issues helped advance the Westside Creeks Restoration Project as the project was recognized in the President’s Budget in June 2021.
CLIMATE RESILIENCY
The River Authority is committed to utilizing the best available science and data to inform our policies, programs, and projects to protect the human and natural resources which are critical to ecological integrity, economic vitality, and quality of life throughout the San Antonio River Basin and across the state. Climate Resiliency is the ability to plan and prepare for, endure, and recover from severe events. Over the past two decades, the San Antonio River Basin has seen more intense short-term droughts as well as more intense wind, hail, rainstorms, and extreme heat events.
The River Authority is focused on improving the basin’s resiliency when experiencing significant changes in precipitation, both floods and droughts, resulting from changing climatic conditions. Protecting and improving the health and safety of the San Antonio River Basin requires the River Authority to use the best available science to inform public policy as well as public and private infrastructure investments.
While we did not identify a specific climate resiliency or climate change metric to include in this report card as a graded score, there were several stories that came out last year that we do believe warrant mention in this section of the report card.
- On July 14, 2020, the World Economic Forum claimed 395 million new jobs would be created by 2030 if businesses prioritize nature.
- On July 27, 2020, the Texas Tribune wrote about how Texas ranchers, activists, and local officials are bracing for megadroughts brought by climate change.
- On December 1, 2020, the World Resource Institute suggested 5 keys to a climate-resilient recovery after COVID-19.
- At the beginning of 2021, reports came out indicating that the billion-dollar disasters of 2020 shattered U.S. record.
- In a year that included many negative stories about the worsening of global climate conditions and biodiversity loss, a positive story came out near the end of the fiscal year indicating that San Antonio is listed by the EPA as among the top cities for green building.
These five stories were including this in the San Antonio River Basin Report Card because we believe it is important to encourage community discussion about climate resiliency. We understand there are challenges associated with the diversity of opinions related to climate change. We believe common ground can be found to support sustainable and scientifically-sound public policies and investments if community discussions are focused on finding solutions that maximize economic, environmental, and quality of life benefits rather than focusing on potential partisan and social divides. We encourage the public to follow and tag the River Authority on Facebook, Twitter, and Instagram and use #BeRiverProud to tell us your thoughts about climate resiliency and climate change, and be sure to tell your elected officials as well.
2020 Report Card
The overall grade for the 2020 San Antonio River Basin Report Card is B. This grade is the average of twelve individual indicator grades, which are explained in greater detail below.
Additional Noteworthy Information
It is a complicated task coming up with a river basin report card. The challenge is determining the metrics that have viable data, are simple to explain, and are repeatable year after year in order to show trends. Then there are the important issues that need to be included but have not been measured for one reason or another – or maybe they are one-off occurrences that are significant enough to mention. There certainly were some important issues that unfolded during our Fiscal Year 2019/2020 (i.e. July 1, 2019 to June 30, 2020). For that reason, we added this final section to the San Antonio River Basin Report Card to capture the top 10 noteworthy bits of information that we did not apply a grade to, but nevertheless, believe are important to mention.
COVID-19
The global pandemic brought about by the COVID-19 virus is clearly the most significant story of 2020. The public health and economic uncertainty we have all been through over the past several months has caused anxiety, impacted plans, and truly altered our lives in one way or another. Through these times, residents throughout the San Antonio River Basin – and indeed around the world – have found respite from the news of the day by enjoying the beauty and peace provided in nature. The tranquility of the outdoors, whether from the river, parks, and hike and bike trails, has provided an escape from the stress of the current times. More people have been seen enjoying a walk, run, bike ride, fishing, or even a paddle along the river, as demonstrated in the Park Usage score in this report card. We are happy to see that our parks and trails have experienced a significant increase in use.
Another interesting side note of the pandemic has been the observation that the shutdown orders had a positive effect on the health and clarity of the San Antonio River itself. Less people on the River Walk and decreased activity along roads and parking lots adjacent to river along with the suspension of the barge traffic resulted in less trash and clearer water allowing passersby to see fish and other aquatic animals more easily. Similar experiences were reported from the all over the world, including the canals of Venice, Italy, and along the River Seine in Paris. We started using the River Authority’s social networks to share news about the positive and negative impacts of the coronavirus on the environment and seeking engagement from our followers by asking them to give us their thoughts about how we can continue to improve creeks and rivers and support sustainable development. Please follow and tag the River Authority on Facebook, Twitter, and Instagram and use #BeRiverProud – we would love to learn about what you think on these important topics.
Since mid-March, the River Authority has adjusted work schedules both in the office and in the field to ensure the health and safety of our employees. We have continued to advance very important deadlines and projects while adhering to social distancing, sanitation, and wearing of masks. Like nearly everyone else, we also went virtual with our events since we could not safely hold large in-person gatherings. We created River Camp! to support our education programs and other virtual offerings to engage with on social media such as River Proud Rhythms and Through the Eyes of an Artist – you can find this new video content on the River Authority’s YouTube channel. The pandemic also forced the 2020 River Rally to go virtual. The River Rally is a national conference hosted each year by the River Network, and it was to be co-hosted by the River Authority in San Antonio this year. The virtual River Rally was a great success and we’re hopeful that the 2021 River Rally will be able to be safely held in San Antonio.
One final COVID-19 related item has to do with the River Authority’s wastewater treatment plants. The River Authority started a collaboration with the University of Texas at San Antonio on a study to determine if community spread and amount of infection within the community could be determined by studying the amount of the virus found in wastewater. This item will be covered in greater detail in the 2021 San Antonio River Basin Report Card as the results will be released later than the publication of this year’s report card.
WASTEWATER TREATMENT PLANT EXPANSIONS
Wastewater utilities provide an incredibly important service to communities that often goes under-appreciated. Simply put, the average citizen has come to expect and rely on good wastewater treatment services without having to put much thought into its value. Wastewater treatment plants (WWTP) not only provide a vital health related service to the community, by treating wastewater to a high-quality effluent, WWTPs also provide a significant water quality and water quantity service to area creeks and rivers.
The River Authority Utilities owns, operates, and maintains several WWTPs and collection systems. The operators and staff continuously attend related accredited sewer and water courses to improve their job performance and maintain or upgrade their state certification status. The plants’ operators are certified by Texas Commission on Environmental Quality (TCEQ). Given the significance of WWTPs, we felt it necessary to include in this year’s basin report card information about two WWTP expansions.
Plans began this year for the expansion of the Salitrillo WWTP to 7.33 MGD to accommodate expected development in the area. This will be a progressive design build project and is anticipated to be complete in 2022. The estimated project cost will be $25 million. Planning has also begun on the expansion of the Martinez IV WWTP, which was first opened in April 2019. Due to the unexpected rapidly developing service area, this WWTP is already near its capacity and is in need of an expansion to 1.5 to 2.0 MGD. The design is projected to be completed in 2022 at a total cost of $10 million.
NEW LAW REQUIRING HOMEOWNERS TO DISCLOSE IF PROPERTY IS IN A FLOODPLAIN
The Texas Legislature in the 86th Legislative Session passed Senate Bill 339, which amended the Texas Property Code such that residential property sellers answer specific flood-related questions about the property for potential purchasers to make flood-informed property acquisition decisions.
Specifically, Texas Property Code 5.020 requires for the sale of a residential property that the seller’s disclosure notice contain separate questions as to whether the property seller is aware of the following property conditions:
- present flood insurance coverage;
- previous flooding due to a failure or breach of a reservoir or a controlled or emergency release of water from a reservoir; or
- previous water penetration into a structure on the property due to a natural flood event;
- the seller is aware the property is located wholly or partly in a 100-year floodplain, 500 year floodplain, floodway, flood pool, or reservoir;
- the seller has ever filed a claim for flood damage to the property with any insurance provider; and
- the seller has ever received assistance from FEMA or the U.S. Small Business Administration for flood damage to the property.
This became law in Texas on September 1, 2019. Equipping present and future residential property owners within the San Antonio River Basin with answers to these flood-related conditions will make Bexar, Wilson, Karnes, and Goliad residents more knowledgeable of flood risks and drive more flood risk informed property purchase decisions. This item was included in this year’s report card because we believe it will help make the residents of the San Antonio River Basin more flood safe and help people make more flood-informed decisions. Over time, this may help improve the Community Flood Insurance Coverage grade.
MANAGEMENT OF INVASIVE SPECIES
River Authority staff are constantly on the lookout for non-native invasive species and will take appropriate actions to help control their spread. For example, when the San Antonio River Walk is drained for maintenance – which happens every few years – River Authority staff typically find and remove two non-native invasive fish species: Plecostomus and tilapia. The Plecostomus is a suckermouth catfish, which is a tropical fish from the armored catfish family. Tilapia is a fish native to Africa and is part of the cichlid family. These two non-native invasive fish species have long been a nuisance in the River Walk and other sections of the San Antonio River.

Unfortunately, a new non-native invasive species, the Apple Snail, was discovered in the River Walk in October 2019. A native of South America, these snails can grow to 6 inches and their presence is often indicated by the bright pink egg sacks that can contain thousands of individual eggs. These snails have few native predators and are voracious herbivores. If they were to establish in the Mission Reach section of the San Antonio River Walk, they would pose a threat. Therefore, our experts are trying to eliminate them where they have been spotted in the Museum Reach and downtown sections of the River Walk.
River Authority staff removed 79 eggs sacks from the River Walk on October 31. Since that initial removal, River Authority staff have removed 100s more egg sacks as we are fighting to contain the spread of this invasive species. The River Authority is bringing in paid consultant support to help augment staff’s removal efforts and we are also offering training to volunteers who are interested in helping to remove the egg sacks. Please sign up to be a River Warrior if you’re interested in joining this fight.
How did the Apple Snail get into the San Antonio River, you may ask? These aquatic species are found in many home aquariums. So, it is most likely that these non-native invasive species, similar to the Plecostomus, have been introduced into our basin by people who have illegally dumped their fish tanks into the river. Citizens are encouraged to help stop the spread of non-native invasive aquatic species by never dumping aquarium contents in a Texas river, lake, or natural body of water.
There are other non-native invasive species to consider as well. Zebra mussels, for example, can multiply rapidly, and infested streams and lakes have reported colonies of zebra mussels taking over habitats and nutrients from native fish and mussel colonies. They can also interfere with recreation and wreak financial havoc on infrastructure. Learn how you can slow the spread of zebra mussels.
You can minimize the impact of non-native invasive bird species by not feeding the wildlife and you can help stop the spread of non-native invasive plant species by only planting native species around your home. Community members who recreate along River Authority parks and trails can also help to stop the spread of non-native species by reporting any new sightings of non-native invasive species to the River Authority’s Environmental Investigations Team. To learn more about how to stop the spread of non-native invasive species, please visit texasinvasives.org.
PROPOSITION 5 PASSED
On November 5, 2019, voters in Texas overwhelmingly passed Proposition 5, a constitutional amendment that directs sales tax funds from the sale of sporting goods throughout the state to the Texas Parks and Wildlife Department (TPWD) and the Texas Historical Commission. This amendment will secure 100% of the sporting goods sales tax for the protection of Texas’ natural areas with a sustained source of funding. The proposition amended language in the Texas Constitution to ensure that funds collected in the future could not be swept up for other uses across the state. This is not a new or raised tax for the taxpayer. Ensuring that these funds are secure for the use of the two organizations provides opportunities for creation and continued development of parks through the TPWD’s local park grant program and allows the TPWD to build and open underdeveloped sites across the state into new and expanded state parks. Providing adequate funding to these two state agencies reinforces the importance of safe, clean, enjoyable natural areas in the San Antonio River Basin and across the state.
PROPOSITION 8 PASSED
Texas Proposition 8, the Flood Infrastructure Fund Amendment, was on the ballot in Texas as a legislatively referred constitutional amendment on November 5, 2019. The amendment was proposed after the state struggled to recover from the devastation of Hurricane Harvey, which dropped several feet of rain on the Houston area in a matter of days. The measure was approved by voters and created a Flood Infrastructure Fund of $800 million, which the Texas Water Development Board (TWDB) has been designated to use to provide financing for flood drainage, mitigation, and control projects. Under this new role, the TWDB has since expanded into administering a new state and regional flood planning process and created flood planning regions based on river basins within the state. These flood planning groups will oversee creating Texas’ first regional flood plans by January 2023, leading to the state’s first state flood plan due in September 2024. Staff from the River Authority will be active participants in this process in the San Antonio River Basin.
TEXAS RANKED 2ND IN BUDGET CUTS FOR ENVIRONMENTAL PROTECTION
On December 5, 2020, the Environmental Integrity Project issued a report title The Thin Green Line which examined the budgets of the environmental agencies in the lower 48 states. The survey looked at annual expenditures and staffing levels from fiscal year 2008 to 2018 for state agencies that protect public health and the environment from all forms of pollution.
The study found that 31 states reduced funding for their environmental agencies’ pollution control programs, and across the nation, states eliminated 4,400 positions at agencies responsible for protecting the environment. Wisconsin was the state that cut the most spending for environmental protection with Texas coming in ranked 2nd in the nation for cuts to environmental protection. From a Texas Tribune article about the report, “But funding cuts in Texas are particularly acute for some pollution control programs, the report found. From 2008 to 2018, the budget for TCEQ’s Pollution Prevention Planning program shrank by 70%, for example.”
We included this item in the 2020 San Antonio River Basin Report Card because it was a story that did not receive that much attention upon it’s release in December 2020. While the nationwide study is not related to the River Authority’s budget, you can learn more on the River Authority’s website about our budget. The River Authority’s Transparency webpage provides easy access to the agency’s financial information. We also encourage you to follow and tag the River Authority on Facebook, Twitter, and Instagram and use #BeRiverProud to tell us your support for environmental protection and sustainable development, and be sure to tell your elected officials as well.
SAN ANTONIO BAY PARTNERSHIP CELEBRATES 10TH ANNIVERSARY
The River Authority promotes a holistic approach to develop and implement projects on a watershed basis as opposed to managing water based solely on the boundaries of legal jurisdictions. The agency also works to secure regional collaboration to support the entire basin, including the bay and estuary ecosystems. As such, the River Authority has been a long-time supporter of the San Antonio Bay Partnership.
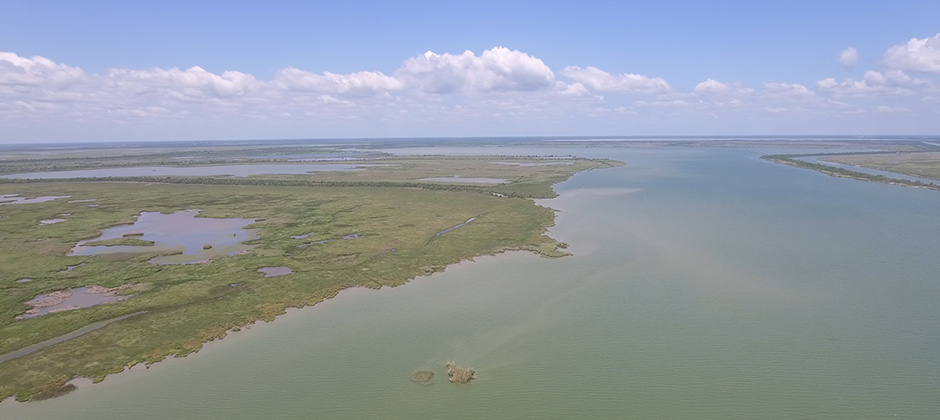
On January 22-23, 2020, the San Antonio Bay Partnership hosted its 10th Anniversary Conference and Celebration. The River Authority was pleased to sponsor and participate in the event. By working collaboratively with other governments, non-profit organizations, stakeholders, community leaders, and citizens, we can sustain and enrich the basin’s ecosystem as well as the lives of the people who live in the basin and the economies of the communities we serve.
TEXAS STORMWATER SCORECARD 2020
On February 6, 2020, Environment Texas released its Texas Stormwater Scorecard 2020. The scorecard evaluates the stormwater management policies of 9 Texas cities and 1 county from across the state to see how well they support the use of nature-based infrastructure to prevent water pollution, mitigate flooding, alleviate drought, and reduce urban heat. Austin was ranked #1 on the 2017 scorecard. The 2020 Texas Stormwater Scorecard identified Austin and San Antonio in a tie for #1. The top score for these two cities was 69% and the lowest score was 36%.
There is room for improvement across the state of Texas for implementing scientifically-sound stormwater management policies and supporting the use of nature-based infrastructure, which can be called by many other names including Green Infrastructure, Green Stormwater Infrastructure, and Low Impact Development. The River Authority has been a long-time proponent of sustainability and green infrastructure. We are grateful that the Environment Texas report identifies our role in the high ranking for San Antonio by stating, “San Antonio focuses on promoting nature-based infrastructure near the City’s environmentally sensitive waterways, thanks in part to the San Antonio River Authority (SARA)’s leadership.”
CLIMATE RESILIENCY
The River Authority is committed to utilizing the best available science and data to inform our policies, programs, and projects to protect the human and natural resources which are critical to ecological integrity, economic vitality, and quality of life throughout the San Antonio River Basin and across the state. Climate Resiliency is the ability to plan and prepare for, endure, and recover from severe events. Over the past two decades, the San Antonio River Basin has seen more intense short-term droughts as well as more intense wind, hail, rainstorms, and extreme heat events.
The River Authority is focused on improving the basin’s resiliency when experiencing significant changes in precipitation, both floods and droughts, resulting from changing climatic conditions. Protecting and improving the health and safety of the San Antonio River Basin requires the River Authority to use the best available science to inform public policy as well as public and private infrastructure investments.
While we did not identify a specific climate resiliency or climate change metric to include in this report card as a graded score, there were three stories that came out last year that we do believe warrant mention in this section of the report card
- On October 17, 2019, the San Antonio City Council adopted the Climate Action and Adaption Plan (CAAP), also known as SA Climate Ready.
- On November 6, 2019, the results of a statewide poll conducted by the University of Texas and the Texas Tribune revealed that two-thirds of Texas registered voters believe climate change is happening, but their urgency about it varies considerably based on their partisan leaning.
- Right at the end of our Fiscal Year on June 29, 2020, just making it into this river basin report card, John Nielsen-Gammon, the State Climatologist, issued a new report indicating “that climate models are robust in projecting drying of summer‐season soil moisture and decreasing reservoir supplies for both the eastern and western portions of Texas during the 21st century.” The extreme droughts that may occur later this century, as predicted by climate models, could include decades-long “megadroughts.” The paper points out that statewide water planning is “based on a rear‐view mirror approach that focuses on historical data and patterns of drought” and “does not take into consideration potential declines in water supply related to future climate change.” This is significant because, as the abstract points out, “The uncertainty in future water availability is substantial.”
These three stories were including this in the San Antonio River Basin Report Card because we believe it is important to encourage community discussion about climate resiliency. We understand there are challenges associated with the diversity of opinions related to climate change. We believe common ground can be found to support sustainable and scientifically-sound public policies and investments if community discussions are focused on finding solutions that maximize economic, environmental, and quality of life benefits rather than focusing on potential partisan divides. We encourage the public to follow and tag the River Authority on Facebook, Twitter, and Instagram and use #BeRiverProud to tell us your thoughts about climate resiliency and climate change, and be sure to tell your elected officials as well.
About the San Antonio River Basin Report Card
Creeks and rivers are ever-changing dynamic systems. They change moment to moment and can have various characteristics, each distinct from the next. To further complicate the matter, the San Antonio River Basin is made up of a complex arrangement of creeks and rivers and their corresponding watersheds. How then does one go about defining what is “healthy” and what are the thresholds to determine how much stress these complex systems can take before they are deemed too “unhealthy” – that is the challenge in coming up with a viable and meaningful river basin report card.
The development of the San Antonio River Basin Report Card grew from the San Antonio River Authority’s (River Authority) drive to harmonize the needs of people and nature through our stewardship of rivers and land. The River Authority first researched the topic of river basin report cards to learn from best management practices from around the world. The Practitioner’s Guide to Developing River Basin Report Cards was also a valuable resource. For additional guidance in the development of this river basin report card, the River Authority also turned to our own mission statement, which states that we are committed to safe, clean, enjoyable creeks and rivers. The main purpose of the San Antonio River Basin Report Card is to shine a light on the healthy and the unhealthy aspects of the basin in order to educate the public and serve as a catalyst for community discussions that lead to individual choices and public policy decisions, actions, and investments that support a sustainable San Antonio River Basin. Ultimately, we intend this basin report card to inspire others to implement positive changes in their behavior that will result in improvements to the health of the San Antonio River Basin.
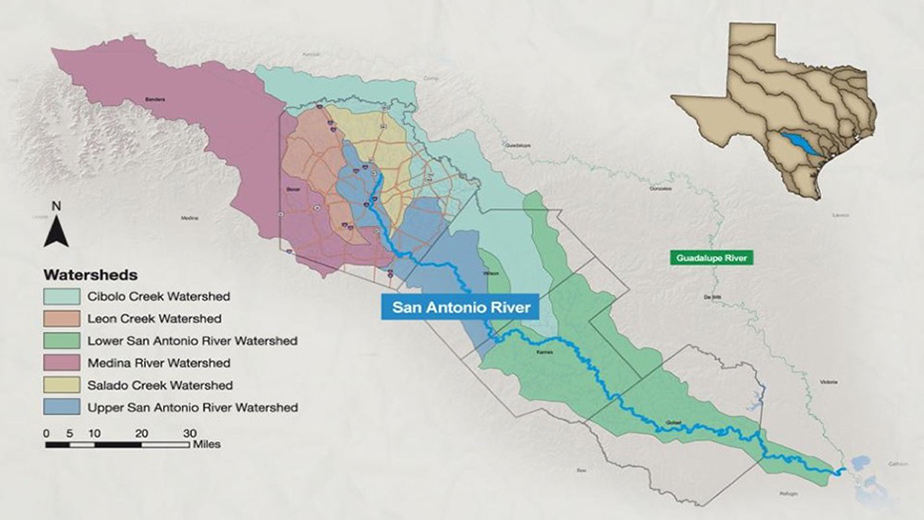
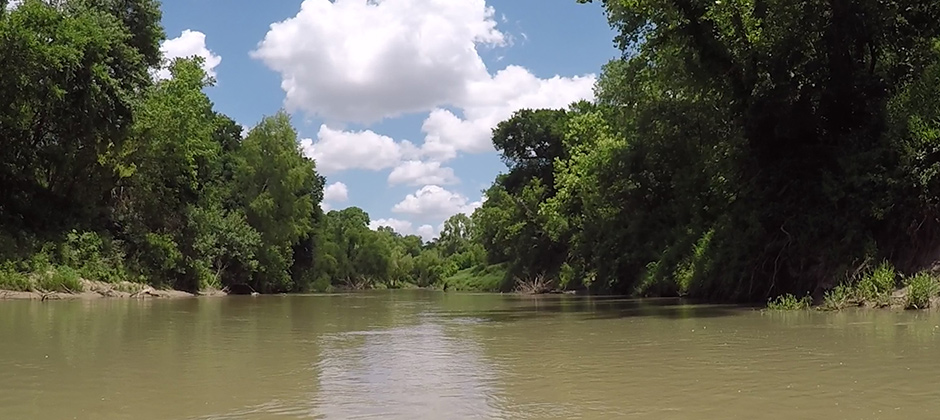
The San Antonio River Basin
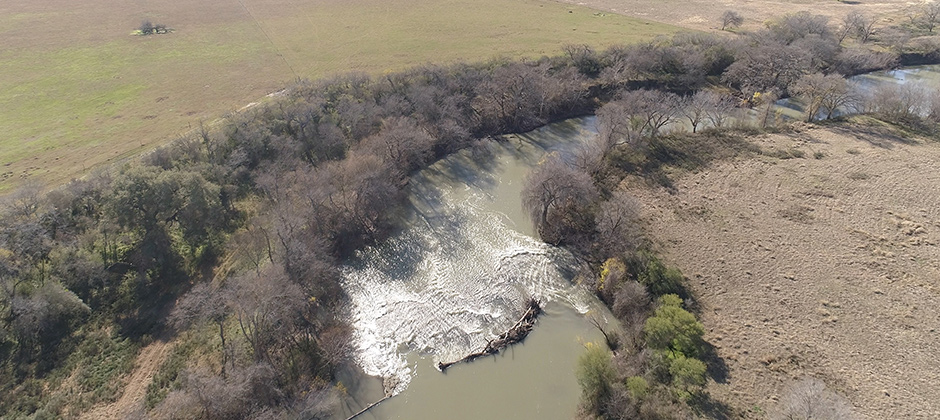
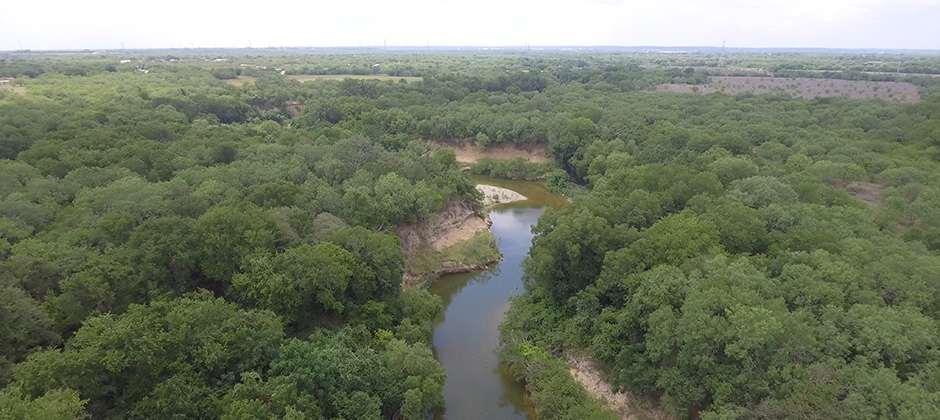
The San Antonio River Basin is one of 23 major basins in the State of Texas. It carries surface water from 2,500-foot elevations within the Texas Hill Country to less than 50-foot elevations near the Gulf Coast. It drains nearly 4,200 square miles, including parts of Atascosa, Bandera, Bexar, Comal, Dewitt, Goliad, Guadalupe, Karnes, Kendall, Kerr, Medina, Refugio, Victoria, and Wilson counties. To learn more about the River Authority, visit our About page. Experience the San Antonio River Basin by taking a virtual tour!
The Indicators
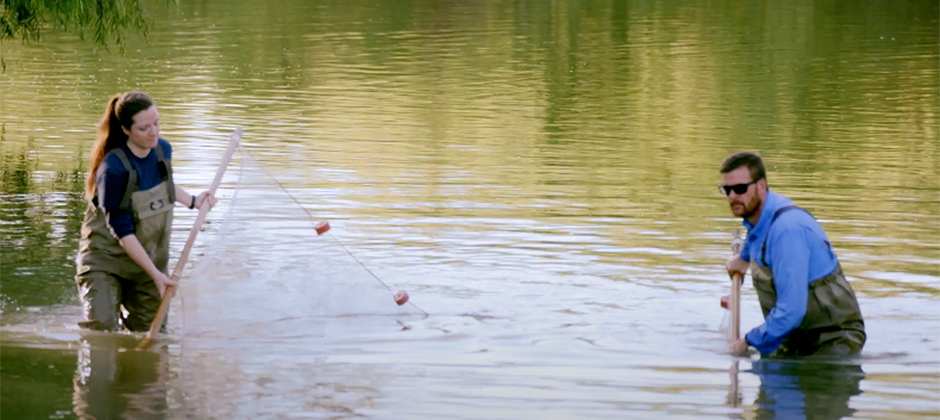
The expert engineers, scientists, technical, and specialized staff of the River Authority exercised their best professional judgment to determine the most meaningful list of indicators for this river basin report card. To help tell the very diverse and complicated story of the San Antonio River Basin in a simple, easy-to-understand way, the River Authority selected twelve indicators that were based on observations of basin health and comprised of accessible and defensible data which could be easily explained to the laymen public. The primary driver for the selection of the twelve indicators was to tell a clear and meaningful story about the health of the San Antonio River Basin. Where feasible, indicators use standards or guidelines established by State or Federal regulatory agencies, such as the Texas Commission on Environmental Quality and the Environmental Protection Agency. The River Authority’s mission of being committed to safe, clean, enjoyable creeks and rivers was also a driver in the indicator selection process.
The explanation for each indicator will provide the rationale for how the indicator is being scored and identify which aspect of the River Authority’s safe, clean, and enjoyable mission is most related to the indicator. Some of the indicators used in the basin report card may clearly relate to more than one of the River Authority’s mission drivers of safe, clean, and enjoyable, and that will also be identified in the explanation write-up.
The “Safe” aspect of the River Authority’s mission is largely related to flood risk management. Public safety through flood risk management is a top priority for the River Authority. For nearly 85 years, cities and counties in the River Authority’s District, as well as the Federal government, have relied on our engineering and technical expertise in flood management and risk reduction. The basin report card indicators that most relate to the “Safe” aspect of the River Authority’s mission are Flood Insurance Coverage, Emergency Calls Regarding Flooding, and Stream Restoration Projects.
The “Clean” aspect of the River Authority’s mission is largely related to the various components that help define the health of the land, creeks, rivers, and bays and estuaries that comprise the San Antonio River Basin. Improving the health of creeks and rivers is the River Authority’s purpose. Since the 1960s, the River Authority’s scientific expertise has generated lasting and recognized improvements in the health of the San Antonio River and its tributaries by leading efforts to protect and enhance water quality and preserve and restore natural habitats and aquatic ecosystems. The basin report card indicators that most relate to the “Clean” aspect of the River Authority’s mission are Swimming Standard, Paddling Standard, Index of Biotic Integrity, Habitat Quality Index, Stormwater Managed, and Instream Flows.
The “Enjoyable” aspect of the River Authority’s mission is largely related to the River Authority’s support of nature-based outdoor recreation. The quality of life and health of citizens who live in the River Authority’s District can be improved through having recreational access along creeks and rivers. Over the past decade, the River Authority has added nature-based recreational activities throughout the basin. With more access, people can develop a greater appreciation for the natural resources and quality of life benefits provided by the San Antonio River and its tributaries. This will, in turn, promote increased preservation and conservation of these resources by individuals, businesses, and government. The basin report card indicators that most relate to the “Enjoyable” aspect of the River Authority’s mission are Public Trash and Park Usage.
The “Indicators and Grades” section of the San Antonio River Basin Report Card will provide a summary of each indicator including why each indicator is important to the health of the San Antonio River Basin and how it is being measured. In addition to the summary, an explanation of the grade will also be given for each indicator along with key findings and recommended actions that could be implemented to improve the grade, including specific examples of ways individual citizens may help improve the health of the river basin. Many of the indicators are grading data gathered during the River Authority’s Fiscal Year, however, some indicators may grade a larger set of data covering multiple years. The write-up for each indicator will clearly state the period being measured and will include links to sources of data and other valuable information. Please also note the term metric and indicator are used interchangeably in the basin report card.
As previously mentioned, it is a difficult task to come up with indicators for a river basin report card. While River Authority staff exercised their best professional judgment to determine the most meaningful list of indicators for this river basin report card, we acknowledge that data can often be interpreted in different ways. Therefore, we will include in the indicator write-ups any potential shortfalls that we recognized in the development of the metrics. We believe it is appropriate to openly acknowledging potential challenges in the interpretation of data. This transparency may lead to future public discussions about the metrics and possibly to improvements in the basin report card methodology. This, in our opinion, will only serve to make the San Antonio River Basin Report Card even more viable and meaningful.
Finally, it is important to note, while the work of the River Authority can and does influence some of the indicators in this river basin report card, this report card is not intended to “grade” the River Authority. The River Authority has a set of metrics related directly to its annual strategic plan to determine how progress is being made on the projects and efforts funded in its annual budget. View the River Authority’s annual budget, which contains its strategic plan.
Grading System
The 12 metrics being graded in the San Antonio River Basin Report Card include a diverse set of measurements with each scoring a different type of unit. Results of each metric are standardized against a common scale of 0-100 to overcome difficulties associated with comparing indicators with different measurement scales and units. Sometimes this conversion is straight-forward; sometimes it can be challenging. An effort has been made in the write-up information for each metric to clearly explain where the data is coming from and how that data is being used to calculate a standardized 0-100 grade.
For this river basin report card, the standard one-hundred-point scale is divided into five equal parts where an “A” equates to 100-80 (Excellent); B is 79.9-60 (Good); C is 59.9-40 (Moderate); D is 39.9-20 (Poor); and an F is 19.9-0 (Failing). The reason for the broader spread in scores is that this scale is more sensitive to, and reflective of, changes in river basin conditions. The larger spread in scores also allows for an easier way to include a plus and minus scale where the upper 5 points of the 20-point range is a plus score and the lower 5 points of the 20-point range is a minus score. The “F” score, however, does not have a plus or minus.
The dashboard for this basin report card will simply show the standard letter grade, including + or – where applicable. The letter grade and the numeric score will both be provided in the write-up information for each individual metric.
Some of the indicators in this basin report card are essentially a trend analysis scoring the current Fiscal Year data against an average of up to five fiscal years of previous data. It is possible for these trend analysis metrics to have a final numeric score above 100 or below 0. The write-ups for these indicators will clearly identify them as a trend analysis and remind readers of the potential for scores to be above or below the standard 0- to 100-point scale. If a final score is above 100, the grade will be shown as an “A+” on the report card dashboard, and a final score below 0 will be shown as a “F” grade on the dashboard. The final numeric score of all twelve indicators will be averaged to produce the overall basin grade.
The San Antonio River Basin Report Card is issued in September to correspond with World Rivers Day, which is the last Sunday in September. With each annual basin report card, the grades for the indicators will show trends that will be highlighted over time. Together, we can achieve and maintain good grades and focus our collective community attention on improving areas that are scoring low.