While all the metrics in the San Antonio River Basin Report Card have overlapping correlation to the safe, clean, enjoyable creeks and rivers aspects of the River Authority’s mission, the Park Usage grade is primarily related to the enjoyable aspect.
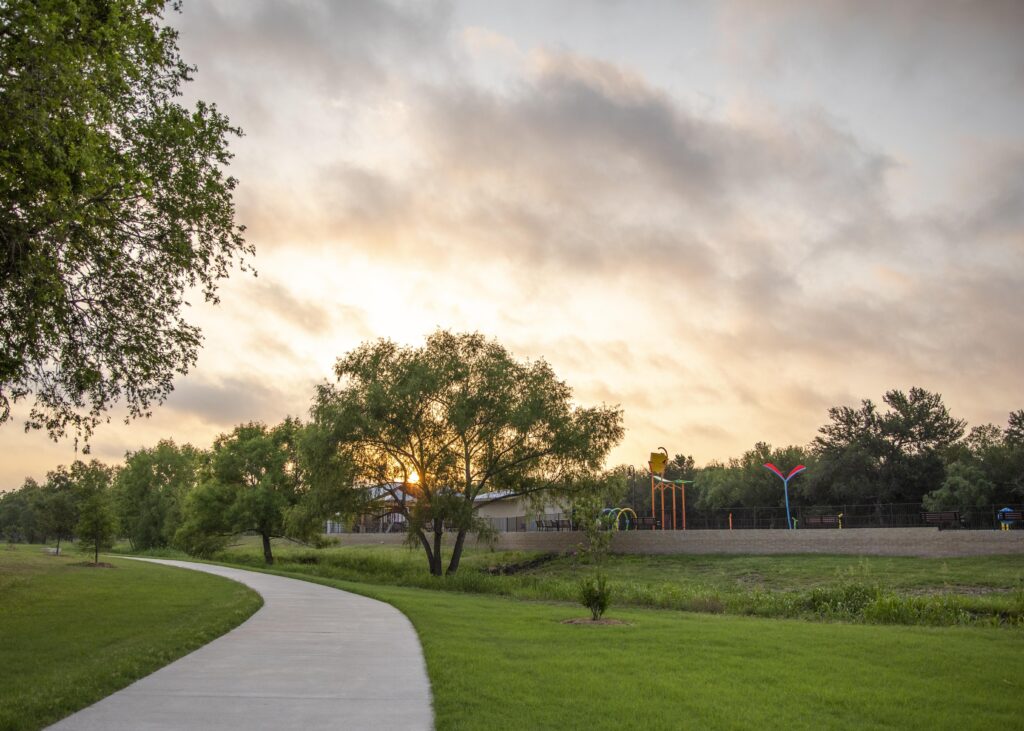
The River Authority’s District is home to over 2.4 million people per the latest Census data, and as development continues to drive local population numbers up, there will be a growing need for all types of recreation facilities. The River Authority firmly supports the health and quality of life benefits of nature-based recreation. Over the past decade, the River Authority has added nature-based recreational activities throughout the basin including hike and bike trails, paddling trails, picnic and camping areas, playgrounds, fishing, birdwatching, and even disc golf courses. These river-based recreational resources have attracted thousands of users to enjoy the beauty of nature.
The River Authority is working to increase the availability of nature-based recreation throughout the San Antonio River Basin by adding to our park assets, collaborating with other government entities to develop park resources along creeks and rivers in the basin, and by working with citizens to promote the use of and connections between recreational facilities that encourage the public to enjoy the natural resources of the area. With more recreational access to creeks and rivers, the River Authority believes individuals will develop a greater appreciation for the natural resources provided by the San Antonio River and its tributaries. This appreciation will lead to awareness of the issues affecting the basin and promote increased preservation and conservation of these natural resources by individuals, businesses, and governments.
Grade for 2022:
A+
How is this being measured?
For this metric, the grade is calculated by using the total park usage for this fiscal year (July 1, 2021 – June 30, 2022) and dividing that number by park usage data from previous fiscal years, then multiply by 100 to get the final score. All of the individual park scores related to usage of parks operated and maintained by the River Authority are averaged together for one grade and a second grade is created for all the individual park scores related to usage of parks located along creeks and rivers throughout the basin which are operated and maintained by other governments or entities. These two grades are then averaged together to determine the final overall grade for this metric. The list of parks being scored are identified in the “Explanation of the Grade” section.
The intent of this grade will be to expand the historical data available over the next few years so there is enough data to allow for a rolling 5-year average to be used in the calculation of the grade. For this year’s basin report card grade, the oldest park usage data we have for some of the parks comes from fiscal year 2017-18, which will allow for a 5-year rolling average to be used in the calculation. Some of the park usage data does not go back all the way to Fiscal Year 2017-18, and in some cases, parks have just opened, or they are identified to open in the future. Therefore, there isn’t yet enough historical data to score each park listed in the “Explanation of the Grade” section. The missing data will be clearly identified in the “Explanation of the Grade” section. We have decided to include the parks with missing data because over the next few years it is anticipated that all the data gaps will be filled allowing for these parks to be properly scored.
Essentially, this grade is a trend analysis for park usage with the basic assumption being that maintaining or increasing the amount of park usage is positive (i.e. will get a higher grade) and a decreasing amount of park usage is negative (i.e. will get a lower grade). Being a trend analysis, it is possible that this grade may produce scores above 100 or below 0. Scores above 100 will be shown as an “A+” on the report card dashboard and a score below 0 will be shown as a “F.” The actual numeric value will be used in the averaging of all metrics to produce the overall basin grade.
There is an exception to this metric as related to the River Authority’s paddling trail usage score. This score is not a trend analysis, but rather is based solely on data from Fiscal Year 2021-22. This score is determined by comparing the reported number of paddlers per the Canoe Trail Goliad and the approved paddling vendors in San Antonio against their beginning of the year projections.
For transparency, the River Authority recognizes that it is possible that overuse of a park may, in the long run, be detrimental to that park. Therefore, it may be argued by some that giving a positive score for increasing park usage may not be the ideal way to grade park usage. We were aware of this concern during the development of the San Antonio River Basin Report Card and decided to proceed with the use of the metric as described above despite its potential shortcomings. The River Authority firmly believes that more access to nature-based parks and paddling trails will provide area residents and visitors a greater appreciation for the natural resources and quality of life benefits provided by the San Antonio River and its tributaries. This increased appreciation will help promote preservation and conservation of these resources by individuals, businesses, and government. We will, however, address the potential threat of park overuse, when necessary, in future report cards in the “Key Findings” section of this metric.
Explanation of the Grade
River Authority Park Usage Score:
Loading..........
The Data is Not Available
Loading..........
The Data is Not Available
Non-River Authority Park Usage Score:
List in order from furthest north to south throughout the basin.
Loading..........
The Data is Not Available
NA: there is no data for this fiscal year. I: there is incomplete data available, which we decided not to use.
Final score: (104.2+168.0)/2 *100 = 136.1, which equates to an A+
For this metric, the City of San Antonio’s Howard W. Peak Greenway Trails System score is based on combining the trail counter totals from the Leon Creek at Ingram Transit Center, Leon Creek at Prue, and Salado Creek at Blanco.
For this metric, the City of San Antonio Parks score is based on combining the estimated visitors to Walker Ranch Historic Landmark Park, McAllister Park, Brackenridge Park, Roosevelt Park, and Medina River Natural Area.
For this metric, the Bexar County Parks score is based on combining the estimated visitors to Mission County Park Pavilions, Mission County Park II, and Padre Park. For Fiscal Year 2021-22, Bexar County does not have data to share because the county was not allowing reservations in county parks due to COVID-19. Therefore, Bexar County was not collecting the park usage data even though their parks were still open and being used by the public during the pandemic. With regards to the circumstances of the pandemic, the River Authority will repeat the numbers of the previous Fiscal Year 2019-20, and in future years, actual data will be used when the data is being collected again.
Key Findings
Park usage is up once again during Fiscal Year 2021-22 as compared with park usage data from previous fiscal years. It is believed that they ongoing COVID-19 pandemic has once again impacted the park usage numbers as citizens remain eager to get outside and utilize the nature-based and cultural park resources throughout the San Antonio River Basin. The City of San Antonio also opened additional hike and bike trails with new trail counters which significantly contributed to the City’s increased park usage data.

As mentioned in last year’s river basin report card, the uncertainty brought about by COVID-19 has caused anxiety, impacted plans, and altered lives in one way or another. For many, the outdoors has provided an escape from the stress of the current times. More people have been seen enjoying a walk, run, bike ride, fishing, or paddle along the San Antonio River. COVID-19 has reminded us that our creeks, rivers, parks, and green spaces are woven into our life as places that we need for personal physical and mental wellbeing as well as our community’s economic strength.
Overall, the data shows a growth in park usage for both River Authority and non-River Authority parks as, collectively, more than 1,355,923 park users were recorded above last fiscal year’s total park usage figure. Of the 16 individual park usage scores, 8 recorded an increase in usage over previous fiscal years and 8 recorded a decrease. As you can see, the increases in usage across the parks that had higher attendance this year far exceeded the decreased attendance in the other parks. The total increased usage was just shy of 1,477,000 whereas the total decrease amongst the others only numbered 121,000.
Recommended Actions
The first recommendation is for the citizens of the San Antonio River Basin to get outside and enjoy all the wonderful nature- and cultural-based parks that can be found throughout the basin.
General information about the River Authority’s parks and paddling trails can be found on our parks & trails page, while current trail closures and paddling trail conditions can be found under current conditions. The River Authority has a history of holding large events and small group educational and walking tours at our parks. While these in-person activities were halted due to concerns related to COVID-19, we are excited to be able to offer these types of events again. Check out the latest event offerings and details, and don’t forget you can reserve your campsite at the John William Helton – San Antonio River Nature Park.
There are many great parks and cultural resources throughout the San Antonio River Basin. The River Authority has also produced a map identifying nearly 75 parks and cultural attractions throughout the basin; the river basin guide is a great resource to plan your next weekend getaway!
Proper hike, bike, and paddling trail etiquette will help ensure that everyone safely enjoys the parks found throughout the basin. Remember: Share the Trail and the River. Respect Other Users. Expect Other Users. Learn more about hiking, biking, and paddling safety.
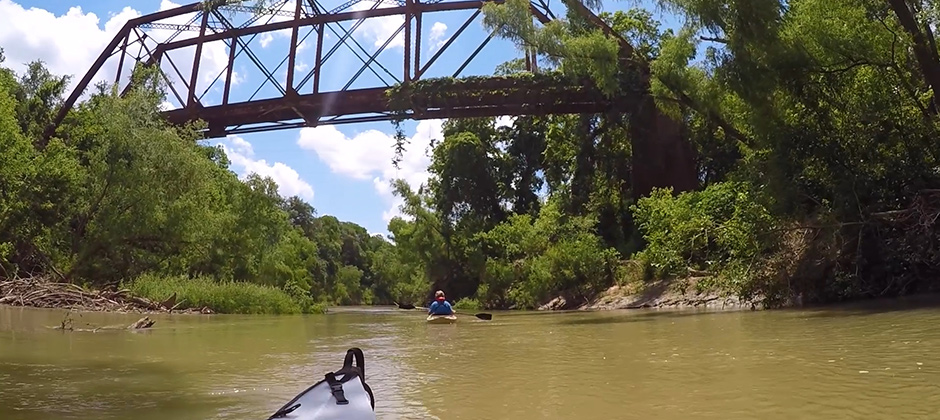
Invasive Zebra mussels have been discovered in lakes and waterways throughout Texas, including this past year in Medina Lake, which is within the San Antonio River Basin. If you paddle on the San Antonio River or one of its tributaries, please help stop the spread of Zebra mussels by properly cleaning your kayaking before using it within the San Antonio River Basin.
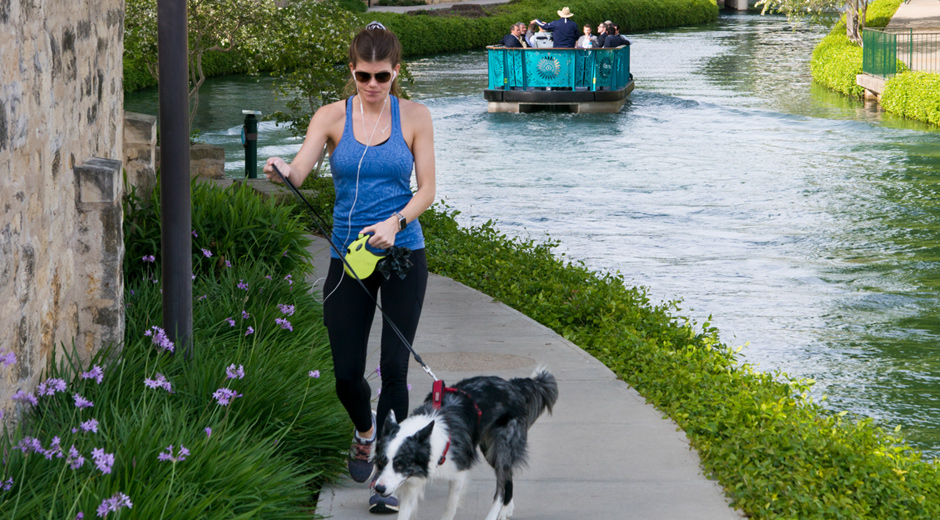
When enjoying parks and green spaces, please remember to keep your pet on a leash and pick up your pet’s waste. Pet waste along the trail is not only unsightly for other visitors, but it can also be washed into the river during rain events, which adds bacteria to the river.

It is equally important for visitors to area parks and green spaces to properly dispose of trash and recycling in appropriate bins. This is why the River Authority has created a new trash initiative to conquer this goal by educating the community and sharing the message of “Don’t Let Litter, Trash Your River.” When visiting a park or green space, please never leave trash or recycling on the ground next to a receptacle. If the container is full, please take your trash or recycling with you until you find an appropriate receptacle to leave your waste or recycling. Together we can achieve trash-free waters in the San Antonio River Basin, so take the pledge today, and “Don’t Let Litter Trash Your River.”
Finally, please follow the River Authority on Facebook, Twitter, and Instagram to get the latest information about the agency and our parks.
Grade for 2021:
A+
How is this being measured?
For this metric, the grade is calculated by using the total park usage for this fiscal year (July 1, 2020 – June 30, 2021) and dividing that number by park usage data from previous fiscal years, then multiply by 100 to get the final score. All of the individual park scores related to usage of parks operated and maintained by the River Authority are averaged together for one grade and a second grade is created for all the individual park scores related to usage of parks located along creeks and rivers throughout the basin which are operated and maintained by other governments or entities. These two grades are then averaged together to determine the final overall grade for this metric. The list of parks being scored are identified in the “Explanation of the Grade” section.
The intent of this grade will be to expand the historical data available over the next few years so there is enough data to allow for a rolling 5-year average to be used in the calculation of the grade. For this year’s basin report card grade, the oldest park usage data we have for some of the parks comes from fiscal year 2017-18, which will allow for a 4-year rolling average to be used in the calculation. Some of the park usage data does not go back all the way to Fiscal Year 2017-18, and in some cases, parks have just opened, or they are identified to open in the future. Therefore, there isn’t yet enough historical data to score each park listed in the “Explanation of the Grade” section. The missing data will be clearly identified in the “Explanation of the Grade” section. We have decided to include the parks with missing data because over the next few years it is anticipated that all the data gaps will be filled allowing for these parks to be properly scored.
Essentially, this grade is a trend analysis for park usage with the basic assumption being that maintaining or increasing the amount of park usage is positive (i.e. will get a higher grade) and a decreasing amount of park usage is negative (i.e. will get a lower grade). Being a trend analysis, it is possible that this grade may produce scores above 100 or below 0. Scores above 100 will be shown as an “A+” on the report card dashboard and a score below 0 will be shown as a “F.” The actual numeric value will be used in the averaging of all metrics to produce the overall basin grade.
There is an exception to this metric as related to the River Authority’s paddling trail usage score. This score is not a trend analysis, but rather is based solely on data from Fiscal Year 2020-21. This score is determined by comparing the reported number of paddlers per the Canoe Trail Goliad and the approved paddling vendors in San Antonio against their beginning of the year projections.
For transparency, the River Authority recognizes that it is possible that overuse of a park may, in the long run, be detrimental to that park. Therefore, it may be argued by some that giving a positive score for increasing park usage may not be the ideal way to grade park usage. We were aware of this concern during the development of the San Antonio River Basin Report Card and decided to proceed with the use of the metric as described above despite its potential shortcomings. The River Authority firmly believes that more access to nature-based parks and paddling trails will provide area residents and visitors a greater appreciation for the natural resources and quality of life benefits provided by the San Antonio River and its tributaries. This increased appreciation will help promote preservation and conservation of these resources by individuals, businesses, and government. We will, however, address the potential threat of park overuse, when necessary, in future report cards in the “Key Findings” section of this metric.
Explanation of the Grade
River Authority Park Usage Score:
Loading..........
The Data is Not Available
Loading..........
The Data is Not Available
Non-River Authority Park Usage Score:
List in order from furthest north to south throughout the basin.
Loading..........
The Data is Not Available
NA = There is no data for this fiscal year.
I = There is incomplete data available, which we decided not to use.
For this metric, the City of San Antonio’s Howard W. Peak Greenway Trails System score is based on combining the trail counter totals from the Leon Creek at Ingram Transit Center, Leon Creek at Prue, and Salado Creek at Blanco.
For this metric, the City of San Antonio Parks score is based on combining the estimated visitors to Walker Ranch Historic Landmark Park, McAllister Park, Brackenridge Park, Roosevelt Park, and Medina River Natural Area.
For this metric, the Bexar County Parks score is based on combining the estimated visitors to Mission County Park Pavilions, Mission County Park II, and Padre Park. For Fiscal Year 2020-21, Bexar County does not have data to share because the county was not allowing reservations in county parks due to COVID-19. Therefore, Bexar County was not collecting the park usage data even though their parks were still open and being used by the public during the pandemic. With regards to the circumstances of the pandemic, the River Authority will repeat the numbers of the previous Fiscal Year 2019-20, and in future years, actual data will be used when the data is being collected again.
Grade: A+
(127.2 + 107.6 / 2 = 117.4)
Key Findings
Park usage is up once again during Fiscal Year 2020-21 as compared with park usage data from previous fiscal years. It is believed that they ongoing COVID-19 pandemic has once again impacted the park usage numbers as citizens remain eager to get outside and utilize the nature-based and cultural park resources throughout the San Antonio River Basin.
As mentioned in last year’s river basin report card, the uncertainty brought about by COVID-19 has caused anxiety, impacted plans, and altered lives in one way or another. For many, the tranquility of the outdoors has provided an escape from the stress of the current times. More people have been seen enjoying a walk, run, bike ride, fishing, or paddle along the San Antonio River. COVID-19 has reminded us that our creeks, rivers, parks, and green spaces are woven into our life as places that we need for personal physical and mental wellbeing as well as our community’s economic strength.
Overall, the data shows a growth in park usage for both River Authority and non-River Authority parks as, collectively, more than 243,000 park users were recorded above last fiscal year’s total park usage figure. Of the 16 individual park usage scores, 11 recorded an increase in usage over previous fiscal years and 5 recorded a decrease.
Recommended Actions
The first recommendation is for the citizens of the San Antonio River Basin to get outside and enjoy all the wonderful nature- and cultural-based parks that can be found throughout the basin.
General information about the River Authority’s parks and paddling trails can be found on our parks & trails page, while current trail closures and paddling trail conditions can be found under current conditions. The River Authority has a history of holding large events and small group educational and walking tours at our parks. While these in-person activities were halted due to concerns related to COVID-19, we are excited to be able to offer these types of events again. Check out the latest event offerings and details, and don’t forget you can reserve your campsite at the John William Helton – San Antonio River Nature Park.
There are many great parks and cultural resources throughout the San Antonio River Basin. The River Authority has also produced a map identifying nearly 75 parks and cultural attractions throughout the basin; the river basin guide is a great resource to plan your next weekend getaway!
Proper hike, bike, and paddling trail etiquette will help ensure that everyone safely enjoys the parks found throughout the basin. Remember: Share the Trail and the River. Respect Other Users. Expect Other Users. Learn more about hiking, biking, and paddling safety.
Invasive Zebra mussels have been discovered in lakes and waterways throughout Texas, including this past year in Medina Lake, which is within the San Antonio River Basin. If you paddle on the San Antonio River or one of its tributaries, please help stop the spread of Zebra mussels by properly cleaning your kayaking before using it within the San Antonio River Basin.
When enjoying parks and green spaces, please remember to keep your pet on a leash and pick up your pet’s waste. Pet waste along the trail is not only unsightly for other visitors, but it can also be washed into the river during rain events, which adds bacteria to the river.
It is equally important for visitors to area parks and green spaces to properly dispose of trash and recycling in appropriate bins. This is why the River Authority has created a new trash initiative to conquer this goal by educating the community and sharing the message of “Don’t Let Litter, Trash Your River.” When visiting a park or green space, please never leave trash or recycling on the ground next to a receptacle. If the container is full, please take your trash or recycling with you until you find an appropriate receptacle to leave your waste or recycling. Together we can achieve trash-free waters in the San Antonio River Basin, so take the pledge today, and “Don’t Let Litter Trash Your River.”
Finally, please follow the River Authority on Facebook, Twitter, and Instagram to get the latest information about the agency and our parks.
Grade for 2020:
A+
How is this being measured?
For this metric, we are creating a score for usage of parks operated and maintained by the River Authority and a second score for usage of parks located along creeks and rivers throughout the basin which are operated and maintained by other governments or entities. These two scores will then be averaged together to determine the final grade for this metric.
This grade is calculated by using a rolling 3-year average of park usage – the list of parks being scored are identified in the “Explanation of the Grade” section. For this year’s basin report card grade, the data for the rolling 3-year average comes from fiscal years 2016-17, 2017-18, and 2018-19. (Note: The River Authority Fiscal Year runs from July 1 to June 30.) The total park usage for this fiscal year (July 1, 2019 – June 30, 2020) is divided by the 3-year average and multiplied by 100 to develop a score.
Essentially, the grade is largely a trend analysis with the basic assumption being that maintaining or increasing the amount of park usage is positive (i.e. will get a higher grade) and a decreasing amount of park usage is negative (i.e. will get a lower grade). Being a trend analysis, it is possible that this grade may produce scores above 100 or below 0. Scores above 100 will be shown as an “A+” on the report card dashboard and a score below 0 will be shown as a “F.” The actual numeric value will be used in the averaging of all metrics to produce the overall basin grade.
There are a couple exceptions to note for this indicator. The first exception is related to the amount of data currently available for this indicator. Some of the park usage data does not go back all the way to Fiscal Year 2016-17, and in some cases, parks have just opened, or they are identified to open in the future. Therefore, there isn’t yet enough data to score each park listed in the “Explanation of the Grade” section. The missing data will be clearly identified in the “Explanation of the Grade” section. We have decided to include the parks with missing data because over the next few years it is anticipated that all the data gaps will be filled allowing for these parks to be properly scored. The intent will be to expand the rolling average used to score this indicator from the rolling 3-year average, as used in this year’s report card, into a rolling 5-year average as the new data becomes available in the coming years.
The second exception to this metric is related to the River Authority’s paddling trail usage score. This score is not a trend analysis, but rather is based solely on data from Fiscal Year 2019-20. This score is determined by comparing the reported number of paddlers per the Canoe Trail Goliad and the approved paddling vendor in San Antonio against their beginning of the year projections.
For transparency, the River Authority recognizes that it is possible that overuse of a park may, in the long run, be detrimental to that park. Therefore, it may be argued by some that giving a positive score for increasing park usage may not be the ideal way to grade park usage. We were aware of this concern during the development of the San Antonio River Basin Report Card and decided to proceed with the use of the metric as described above despite its potential shortcomings. The River Authority firmly believes that more access to nature-based parks and paddling trails will provide area residents and visitors a greater appreciation for the natural resources and quality of life benefits provided by the San Antonio River and its tributaries. This increased appreciation will help promote preservation and conservation of these resources by individuals, businesses, and government. We will, however, address the potential threat of park overuse, when necessary, in future report cards in the “Key Findings” section of this metric.
Explanation of the Grade
River Authority Park Usage Score:
Loading..........
The Data is Not Available
Loading..........
The Data is Not Available
Non-River Authority Park Usage Score:
List in order from furthest north to south throughout the basin.
Loading..........
The Data is Not Available
NA = not available
For this metric, the City of San Antonio’s Howard W. Peak Greenway Trails System score is based on combining the trail counter totals from the Leon Creek at Ingram Transit Center, Leon Creek at Prue, and Salado Creek at Blanco.
For this metric, the City of San Antonio Parks score is based on combining the estimated visitors to Walker Ranch Historic Landmark Park, McAllister Park, Brackenridge Park, Roosevelt Park, and Medina River Natural Area.
For this metric, the Bexar County Parks score is based on combining the estimated visitors to Mission County Park Pavilions, Mission County Park II, and Padre Park.
Grade: A+
(123.3 + 100.9 / 2 = 112.1)
Key Findings
Overall, park usage is up over 100% during Fiscal Year 2019-20 as compared with park usage data from previous fiscal years, which is a good indicator that citizens are getting outside and utilizing the nature-based and cultural park resources throughout the San Antonio River Basin. While there are many potential explanations for the increased usage of parks and green space throughout the basin, one likely reason is related to the COVID-19 pandemic.
The uncertainty brought about by COVID-19 has caused anxiety, impacted plans, and altered lives in one way or another. For many, the tranquility of the outdoors has provided an escape from the stress of the current times. More people have been seen enjoying a walk, run, bike ride, fishing, or paddle along the San Antonio River. COVID-19 has reminded us that our creeks, rivers, parks, and green spaces are woven into our life as places that we need for personal physical and mental wellbeing as well as our community’s economic strength.
Some data demonstrates a significant increase in park use over the last several months during the time of community-wide business shutdowns due to COVID-19. For example, trail counters along the Mission Reach registered nearly 124,000 hits this April and May. That equates to over 7,000 more users on the trails each week this year as compared to this same time a year ago, which is an 83% increase! A similar increase of use, likely due to COVID-19, was seen along the Howard W. Peak Greenway Trails System as well. After an initial downturn in paddling due to COVID-19 shutdowns, Paddling along the river is also showing signs of growing as people (practicing social distancing) are taking to kayaking to get fresh air and disconnect from virtual learning and remote work in order to relax along the river.
Not all parks saw an increase in usage that is likely attributable to COVID-19 lockdowns. In fact, some parks likely experienced a decrease in usage due to the pandemic. The differential in the data for this report card between parks that experienced an increase in visitation during the COVID-19 lockdown versus those that saw a decrease in attendance appears to be that parks that are primarily used for outdoor recreation (e.g. the Mission Reach) experienced more visitors whereas parks that are primarily a destination (e.g. Presidio La Bahia) or used as an event or group sporting location (e.g. Mission Park Pavilions or the special use athletic fields at Helton Nature Park) experienced a decrease in visitors.
Recommended Actions
The first recommendation is for the citizens of the San Antonio River Basin to get outside and enjoy all the wonderful nature- and cultural-based parks that can be found throughout the basin.
General information about the River Authority’s parks and paddling trails can be found on our parks & trails page, while current trail closures and paddling trail conditions can be found under current conditions. The River Authority has a history of holding large events and small group educational and walking tours at our parks. While these in-person activities were halted due to concerns related to COVID-19, we are hopeful in time to be able to offer these types of events again. Check out the latest event offerings and details, and don’t forget you can reserve your campsite at the John William Helton – San Antonio River Nature Park.
There are many great parks and cultural resources throughout the San Antonio River Basin. The River Authority has also produced a map identifying nearly 75 parks and cultural attractions throughout the basin; the river basin guide is a great resource to plan your next weekend getaway!
Proper hike, bike, and paddling trail etiquette will help ensure that everyone safely enjoys the parks found throughout the basin. Remember: Share the Trail and the River. Respect Other Users. Expect Other Users. Learn more about hiking, biking, and paddling safety.
Invasive Zebra mussels have been discovered in lakes and waterways throughout Texas, including in Central and South Texas. If you paddle on the San Antonio River or one of its tributaries, please help stop the spread of Zebra mussels.
When enjoying parks and green spaces, please remember to keep your pet on a leash and pick up your pet’s waste. Pet waste along the trail is not only unsightly for other visitors, but it can also be washed into the river during rain events, which adds bacteria to the river.
It is equally important for visitors to area parks and green spaces to properly dispose of trash and recycling in appropriate bins. When visiting a park or green space, please never leave trash or recycling on the ground next to a receptacle. If the container is full, please take your trash or recycling with you until you find an appropriate receptacle to leave your waste or recycling.
Finally, please follow the River Authority on Facebook, Twitter, and Instagram to get the latest information about the agency and our parks.