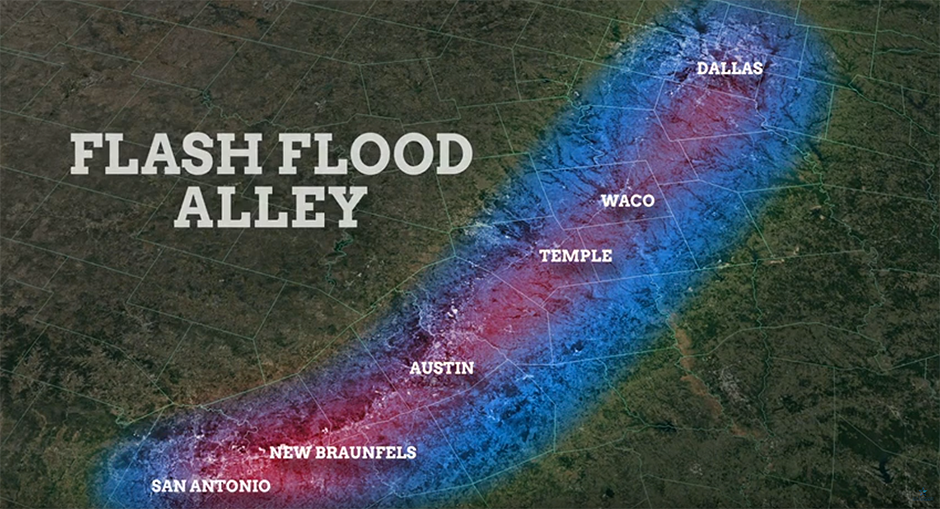
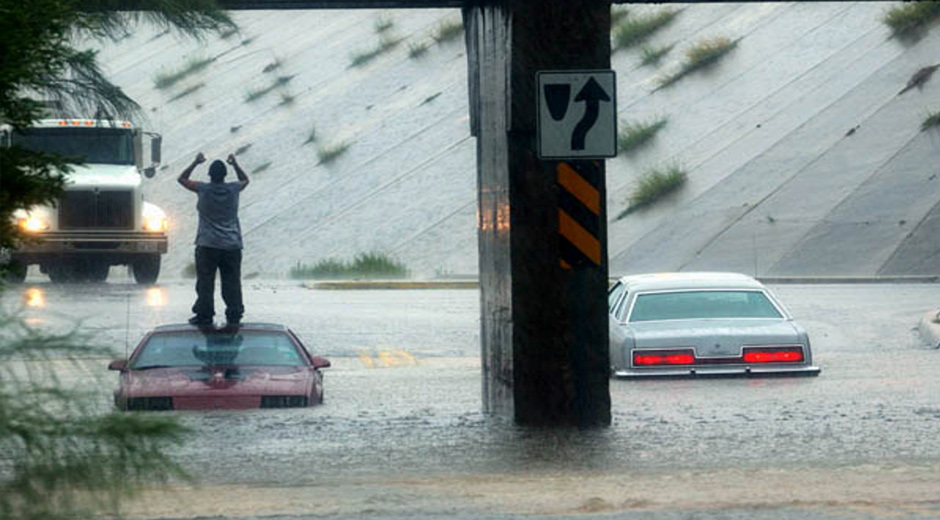
While all the metrics in the San Antonio River Basin Report Card have overlapping correlation to the safe, clean, enjoyable creeks and rivers aspects of the River Authority’s mission, the Number of Emergency Calls Regarding Flooding grade is primarily related to the safe aspect. Within the San Antonio River Basin, the City of San Antonio and Bexar County have a long history of flooding and flash flooding. This area is part of Flash Flood Alley, making this large metropolitan area one of the most flood-prone regions in North America. Flash floods can occur within minutes to a few hours following a heavy rainfall event. Many of these events, unfortunately, have included fatalities. Urbanization can increase runoff up to 6 times over what would occur in natural areas. Impervious cover does not allow rainfall to filter into the ground; therefore, urban flooding can become dangerous as streets, freeways, underpasses, and parking lots fill with stormwater runoff. In addition to the threats to life and property caused by urban floods, stormwater runoff can have a significantly negative impact on other issues such as water quality and creek and river erosion. Finally, river flooding can occur when heavy rain falls over a wide area for a prolonged period. Within the San Antonio River Basin, heavy storms in the San Antonio area, may result in river flooding in Wilson, Karnes, or Goliad counties several days after the initial rainfall. Typically, the slow rising nature of river flooding provides enough advance warning to evacuate people and property (including livestock) from harm’s way, particularly in the downstream portions of the basin. Understanding these different types of flooding is important because, according to the National Weather Service (NWS), floods and flash floods kill more people across the nation than any other weather disaster. During the measurement period for this report card, the residents of Texas were reminded of the high risks associated with severe storms and flooding. In the span of just a few months in 2020, the State was hit by Hurricane Hanna in July, the remnants of Hurricane Marco and Hurricane Laura in August, and Tropical Storm Beta in September, each storm caused widespread flooding and highwater rescues. More locally, Wilson County experienced one flash flood event in September 2020, and Bexar County experienced a flash flood event in April 2021.
Grade for 2022:
A-
How is this being measured?
In developing and reporting this metric, we used the number of emergency calls related to flooding. This data was provided by County emergency managers and first responders. The grade is calculated using a rolling 5-year average of flood-related emergency calls as a base line. For this year’s basin report card grade, the rolling 5-year average data includes fiscal years 2017 – 18, 2018-19, 2019-20, 2020-21, and 2021-22. (Note: The River Authority Fiscal Year runs from July 1 to June 30.) The total number of flood-related emergency calls this fiscal year (July 1, 2021 – June 30, 2022) was subtracted from the base line, divided by the base line and multiplied by 100 to develop a score.
This was done separately for flood-related emergency calls in Bexar, Wilson, Karnes, and Goliad counties. The four individual county scores were then averaged to determine a basin-wide A through F grade.
Essentially, the grade is a trend analysis with the basic assumption being that lowering the number of flood-related emergency calls is positive (i.e. will get a higher grade) and increasing flood-related emergency calls is negative (i.e. will get a lower grade). It is possible that this grade may produce scores above 100 or below 0. Scores above 100 will be shown as an “A+” on the report card dashboard and a score below 0 will be shown as a “F.” The actual numeric value will be used in the averaging of all metrics to produce the overall basin grade.
This report card grade can improve over time as fewer emergency calls are made during flood events. However, we are by no means suggesting that flood-related emergency calls should not be made. We absolutely want, and recommend, that individuals call 911 during an emergency if assistance is needed. It is the River Authority’s intention with this grade to raise flooding awareness and encourage personal responsibility during flood events that, over time, may result in fewer emergency calls being made because people are not finding themselves in dangerous situations during flood events.
Explanation of the Grade
Loading..........
The Data is Not Available
Basin-wide grade (-17.3 + 100 + 100 + 100) / 4 = 70.7
Grade: B
Key Findings
The key findings of this grade correlates well with the known understanding of the various types of flood risk found throughout the San Antonio River Basin. Bexar County, being in Flash Flood Alley and heavily urbanized, has a higher risk of both flash flooding and urban flooding. The data shows that all the flood-related emergency calls logged over the past five fiscal years occurred in Bexar County.
While river flooding is a concern in Bexar County, it is the more prevalent type of flooding that would likely occur in Wilson, Karnes, and Goliad counties. There is typically enough time to evacuate people from low-lying areas during a river flooding event. This appears to be reflected in the fact that there have been no emergency calls related to flooding in Wilson, Karnes, and Goliad counties during the past five fiscal years.
Annual rainfall rates also impact this report card grade. It could be assumed that years with more rainfall, may result in an increase in flood-related emergency calls. That assumption may not always be correct, however, given that even in a dry year there could be heavy storm events that result in flood-related emergency calls. Per National Weather Service rainfall data, a total of 22.1 inches of rain fell in San Antonio during Fiscal Year 2021-22 (July 2021-June 2022). This compares to the rainfall totals for the previous four fiscal years of 29.7 (2017-18), 48.3 (2018-19), 28.0 (2019-20), and 24.3 (2020-21).
Please note, we recognize the San Antonio River Basin is a large region and annual rainfall totals will differ between cities and areas of the basin. We reference annual rainfall totals in the City of San Antonio in this report card for two reasons: Bexar County (and the City of San Antonio) is where all the emergency calls related to flooding have occurred for the purpose of this year’s report card; and being near the top of the basin, rainfall in San Antonio contributes to potential river flooding downstream of Bexar County.
Recommended Actions
As individuals make safer choices during flood events, this may result in fewer emergency calls over time; thus, improving the grade for this indicator. We absolutely recommend that you call 911 during an emergency if assistance is needed. Here are some good tips to remember to help you stay safe during a flood:
- Do not attempt to walk or swim through flood waters.
- Many flood-related deaths occur in vehicles. It’s important to know that it can only take one foot of moving water to sweep your vehicle away. So, Turn Around, Don’t Drown!
- Depending on the type of flooding, listen to the directions provided by local emergency authorities:
- Evacuate if told to do so;
- Move to higher ground or a higher floor; or
- Stay where you are.
- If you live in Bexar County, check whether the low water crossings on your route are flooded at BexarFlood.org, and if so, plan an alternate route.
- If you know of a low water crossing that is frequently dangerous due to high flood water, add your input the Region 12 Flood Planning process.
The River Authority, together with various local, county, and federal government collaborators, are working to make the San Antonio River Basin safer from flooding. Given that the River Authority cannot use the tax revenue we collect to build capital improvement projects, the River Authority uses its scientific and engineering expertise to develop data that supports other community funding decisions related to the development and implementation of flood mitigation projects.
In the Bexar County area, the River Authority has been working collaboratively with Bexar County, the City of San Antonio, and the suburban cities within Bexar County since the early 2000s under the framework of an interlocal agreement (ILA) known as the Bexar Regional Watershed Management Partnership (BRWM). This intergovernmental collaboration has led to a significant improvement in flood mitigation. Water knows no boundaries, so coming together to best utilize limited public resources in a collaborative fashion has provided good results. One example of this collaboration is the BexarFlood.org website. This site, which was funded by Bexar County and now operated by the River Authority, shows road conditions of monitored low water crossings across Bexar County.
The River Authority has been working with the BRWM partner agencies to complete Watershed Master Plans for the Upper San Antonio River, Leon Creek, Salado Creek, Medina River, Lower San Antonio River, and Cibolo Creek watersheds. The Master Plans have two primary objectives:
- Identify needs and opportunities related to flood risk, water quality issues, low impact development, stream restoration, nature-based park planning, mitigation banking, and conservation easements; and
- Develop and assess proposed projects to address the identified needs and preserve identified opportunities.
Additionally, the River Authority has recently completed developing a near real-time flood alert system that provides the City of San Antonio/Bexar County Emergency Operations Center flood predictions to help community first responders better understand what areas will be at the greatest risk during heavy rain events. The prediction system will allow for emergency management decisions to be made to help guide the protection of life and property in the Bexar County area. Various flood scenarios have also been provided to the emergency managers of Wilson, Karnes, and Goliad counties to help with community preparations and response to the slower moving, yet still dangerous, river flooding possibilities for these southern basin communities.
Finally, since government collaboration and funding will not likely be able to solve all flooding challenges, it is also recommended that individuals learn more about flood risk in their area. The River Authority’s Floodplain Viewer engages users in an interactive floodplain map, displaying FEMA’s National Flood Hazard Layer data. The Risk MAP viewer created by the River Authority allows a property owner to determine the level of flood risk across the life of a 30-year mortgage. The River Authority encourages homeowners to assess their home’s flood risk, and for those interested in learning more, the River Authority has information available to the public about the science of flood management and our flood risk engineering studies.

Grade for 2021:
A-
How is this being measured?
In developing and reporting this metric, we used the number of emergency calls related to flooding. This data was provided by County emergency managers and first responders. The grade is calculated using a rolling 4-year average of flood-related emergency calls as a base line. For this year’s basin report card grade, the rolling 4-year average data includes fiscal years 2016-17, 2017-18, 2018-19, and 2019-20. (Note: The River Authority Fiscal Year runs from July 1 to June 30.) The total number of flood-related emergency calls this fiscal year (July 1, 2020 – June 30, 2021) was subtracted from the base line, divided by the base line and multiplied by 100 to develop a score.
This was done separately for flood-related emergency calls in Bexar, Wilson, Karnes, and Goliad counties. The four individual county scores were then averaged to determine a basin-wide A through F grade.
Essentially, the grade is a trend analysis with the basic assumption being that lowering the number of flood-related emergency calls is positive (i.e. will get a higher grade) and increasing flood-related emergency calls is negative (i.e. will get a lower grade). It is possible that this grade may produce scores above 100 or below 0. Scores above 100 will be shown as an “A+” on the report card dashboard and a score below 0 will be shown as a “F.” The actual numeric value will be used in the averaging of all metrics to produce the overall basin grade.
This indicator will include additional data in future years. The available data for this indicator only allows for a 4-year rolling average for comparison in this year’s basin report card. The intent is to expand the rolling average over a 5-year span by 2022.
This report card grade can improve over time as fewer emergency calls are made during flood events. However, we are by no means suggesting that flood-related emergency calls should not be made. We absolutely want, and recommend, that one calls 911 during an emergency if assistance is needed. It is the River Authority’s intention with this grade to raise flooding awareness and encourage personal responsibility during flood events that, over time, may result in fewer emergency calls being made because people are not finding themselves in dangerous situations during flood events.
Explanation of the Grade
Loading..........
The Data is Not Available
Basin-wide grade: A-
(21.3+100+100+100/4 = 80.3)
Key Findings
The key findings of this grade correlates well with the known understanding of the various types of flood risk found throughout the San Antonio River Basin. Bexar County, being in Flash Flood Alley and heavily urbanized, has a higher risk of both flash flooding and urban flooding. The data shows that all the flood-related emergency calls logged over the past five fiscal years occurred in Bexar County.
While river flooding is a concern in Bexar County, it is the more prevalent type of flooding that would likely occur in Wilson, Karnes, and Goliad counties. There is typically enough time to evacuate people from low-lying areas during a river flooding event. This appears to be reflected in the fact that there have been no emergency calls related to flooding in Wilson, Karnes, and Goliad counties during the past four fiscal years.
Annual rainfall rates may also impact this report card grade. It could be assumed that years with more rainfall, may result in an increase in flood-related emergency calls. That assumption may not always be correct, however, given that even in a dry year there could be heavy storm events that result in flood-related emergency call. Per National Weather Service rainfall data, a total of 24.27 inches of rain fell in San Antonio during Fiscal Year 2020-21 (July 2020-June 2021). This compares to the rainfall totals for the previous four fiscal years of 33.18 (2016-17), 29.72 (2017-18), 48.33 (2018-19), and 28.04 (2019-20).
Please note, we recognize the San Antonio River Basin is a large region and annual rainfall totals will differ between cities and areas of the basin. We reference annual rainfall totals in the City of San Antonio in this report card for two reasons: Bexar County (and the City of San Antonio) is where all the emergency calls related to flooding have occurred for the purpose of this year’s report card; and being near the top of the basin, rainfall in San Antonio contributes to potential river flooding downstream of Bexar County.
Recommended Actions
As individuals make safer choices during flood events, this may result in fewer emergency calls over time; thus, improving the grade for this indicator. We absolute recommend that you call 911 during an emergency if assistance is needed. Here are some good tips to remember to help you stay safe during a flood:
- Do not attempt to walk or swim through flood waters.
- Many flood-related deaths occur in vehicles. It’s important to know that it can only take one foot of moving water to sweep your vehicle away. So, Turn Around, Don’t Drown!
- Depending on the type of flooding, listen to the directions provided by local emergency authorities:
- Evacuate if told to do so;
- Move to higher ground or a higher floor; or
- Stay where you are.
The River Authority, together with various local, county, and federal government collaborators, are working to make the San Antonio River Basin safer from flooding. Given that the River Authority cannot use the tax revenue we collect to build capital improvement projects, the River Authority uses its scientific and engineering expertise to develop that data that supports other community funding decisions related to the development and implementation of flood mitigation projects.
In the Bexar County area, the River Authority has been working collaboratively with Bexar County, the City of San Antonio, and the suburban cities within Bexar County since the early 2000s under the framework of an interlocal agreement (ILA) known as the Bexar Regional Watershed Management Partnership (BRWM). This intergovernmental collaboration has led to a significant improvement in flood mitigation. Water knowns no boundaries, so coming together to best utilize limited public resources in a collaborative fashion has provided good results. One example of this collaboration is the BexarFood.org website. This site, which was funded by Bexar County and now operated by the River Authority, shows road conditions of monitored low water crossings across Bexar County.
The River Authority has been working with the BRWM partner agencies to complete Watershed Master Plans for the Upper San Antonio River, Leon Creek, Salado Creek, Medina River, Lower San Antonio River, and Cibolo Creek watersheds. The Master Plans have two primary objectives:
- Identify needs and opportunities related to flood risk, water quality issues, low impact development, stream restoration, nature-based park planning, mitigation banking, and conservation easements; and
- Develop and assess proposed projects to address the identified needs and preserve identified opportunities.
Additionally, the River Authority has recently completed developing a near real-time flood alert system that provides the City of San Antonio/Bexar County Emergency Operations Center flood predictions to help community first responders better understand what areas will be at the greatest risk during heavy rain events. The prediction system will allow for emergency management decisions to be made to help guide the protection of life and property in the Bexar County area. Various flood scenarios have also been provided to the emergency managers of Wilson, Karnes, and Goliad counties to help with community preparations and response to the slower moving, yet still dangerous, river flooding possibilities for these southern basin communities.
Finally, since government collaboration and funding will not likely be able to solve all flooding challenges, it is also recommended that individuals learn more about flood risk in their area. The River Authority’s Floodplain Viewer engages users in an interactive floodplain map, displaying FEMA’s National Flood Hazard Layer data. The Risk MAP viewer created by the River Authority allows a property owner to determine the level of flood risk across the life of the 30-year mortgage. The River Authority encourages homeowners to assess their home’s flood risk, and for those interested in learning more, the River Authority has information available to the public about the science of flood management and our flood risk engineering studies.
Grade for 2020:
A-
How is this being measured?
In developing and reporting this metric, we are using the number emergency calls made related to flooding. This data is being provided to us by county emergency managers. The grade is calculated by using a rolling 3-year average of emergency calls made related to flooding as a base line. For this year’s basin report card grade, the data for the rolling 3-year average comes from fiscal years 2016-17, 2017-18, and 2018-19. (Note: The River Authority Fiscal Year runs from July 1 to June 30.) The total number of emergency calls made related to flooding this fiscal year (July 1, 2019 – June 30, 2020) is subtracted from the base line, then divided by the base line, and multiplied by 100 to develop a score.
This is done separately for emergency calls made related to flooding in Bexar, Wilson, Karnes, and Goliad counties. The four individual county scores are then averaged to determine a basin-wide A through F grade.
Essentially, the grade is a trend analysis with the basic assumption being that lowering the amount of emergency calls made related to flooding is positive (i.e. will get a higher grade) and increasing emergency calls related to flooding is negative (i.e. will get a lower grade). Being a trend analysis, it is possible that this grade may produce scores above 100 or below 0. Scores above 100 will be shown as an “A+” on the report card dashboard and a score below 0 will be shown as a “F.” The actual numeric value will be used in the averaging of all metrics to produce the overall basin grade.
This indicator will include additional data in future years. The available data for this indicator only allows for a rolling 3-year average for comparison in this year’s basin report card. The intent will be to expand the rolling average into a 5-year span, which will be implemented by the 2022 river basin report card.
This report card grade can improve over time as fewer emergency calls are made during flood events. However, by no means are we suggesting that emergency calls related to flooding should be made. We absolute want and recommend that you call 911 during an emergency if assistance is needed. It is the River Authority’s intention with this grade to raise flooding awareness, and by doing so, encourage personal responsibility during flood events that, overtime, may result in fewer emergency calls being made because people are not finding themselves in dangerous situations during flood events.
Explanation of the Grade
Loading..........
The Data is Not Available
Basin-wide grade: A-
(32+100+100+100/4 = 83.0)
Key Findings
The key findings of this grade correlates well with the known understanding of the various types of flood risk found throughout the San Antonio River Basin. Bexar County, being in Flash Flood Alley and heavily urbanized, has a higher risk of both flash flooding and urban flooding. The data shows that all the emergency calls related to flooding logged over the past four fiscal years occurred in Bexar County.
While river flooding is a concern in Bexar County, it is the more prevalent type of flooding that would likely occur in Wilson, Karnes, and Goliad counties. There is typically enough time to evacuate people from low-lying areas during a river flooding event, and this appears to be reflected in the fact that there have been no emergency calls related to flooding in Wilson, Karnes, and Goliad counties during the past four fiscal years.
Annual rainfall rates also impact this report card grade. Years that have more rainfall may be likely to have more flooding which may result in an increase in emergency calls. Per National Weather Service rainfall data, a total of 28.04 inches of rain fell in San Antonio during Fiscal Year 2019-20 (July 2019-June 2020). This compares to the rainfall totals for the previous three fiscal years of 33.18 (2016-17), 29.72 (2017-18), and 48.33 (2018-19). The data appears to show some degree of correlation between the number of emergency calls made regarding flooding and the annual rainfall totals.
Please note, we recognize the San Antonio River Basin is a large region and annual rainfall totals will differ between cities and areas of the basin. We reference annual rainfall totals in the City of San Antonio in this report card for two reasons: Bexar County (and the City of San Antonio) is where all the emergency calls related to flooding have occurred for the purpose of this year’s report card; and being near the top of the basin, rainfall in San Antonio contributes to potential river flooding downstream of Bexar County.
Recommended Actions
As individuals make safer choices during flood events, this may result in fewer emergency calls over time; thus, improving the grade for this indicator. We absolute recommend that you call 911 during an emergency if assistance is needed. Here are some good tips to remember to help you stay safe during a flood:
- Do not attempt to walk or swim through flood waters.
- Many flood-related deaths occur in vehicles. It’s important to know that it can only take one foot of moving water to sweep your vehicle away. So, Turn Around, Don’t Drown!
- Depending on the type of flooding, listen to the directions provided by local emergency authorities:
- Evacuate if told to do so;
- Move to higher ground or a higher floor; or
- Stay where you are.
The River Authority, together with various local, county, and federal government collaborators are working to make the San Antonio River Basin safer from flooding. Given that the River Authority cannot use the tax revenue we collect to build capital improvement projects, the River Authority uses its scientific and engineering expertise to develop that data that supports other community funding decisions related to the development and implementation of flood mitigation projects.
In the Bexar County area, the River Authority has been working collaboratively with Bexar County, the City of San Antonio, and the suburban cities within Bexar County since the early 2000s under the framework of an interlocal agreement (ILA) known as the Bexar Regional Watershed Management Partnership (BRWM). This intergovernmental collaboration has led to a significant improvement in flood mitigation. Water knowns no boundaries, so coming together to best utilize limited public resources in a collaborative fashion has provided good results. One example of this collaboration is the BexarFlood.org website. This site, which was funded by Bexar County and now operated by the River Authority, shows road conditions of monitored low water crossings across Bexar County.
The River Authority has been working with the BRWM partner agencies to complete Watershed Master Plans for the Upper San Antonio River, Leon Creek, Salado Creek, Medina River, Lower San Antonio River, and Cibolo Creek watersheds. The Master Plans have two primary objectives:
- Identify needs and opportunities related to flood risk, water quality issues, low impact development, stream restoration, nature-based park planning, mitigation banking, and conservation easements; and
- Develop and assess proposed projects to address the identified needs and preserve identified opportunities.
Additionally, the River Authority is developing a near real-time flood alert system that, when complete, will be provided to the City of San Antonio/Bexar County Emergency Operations Center to help community first responders to better understand what areas will be at the greatest risk during heavy rain events. The prediction system will allow for emergency management decisions to be made to help guide the protection of life and property in the Bexar County area. Various flood scenarios have also been provided to the emergency managers of Wilson, Karnes, and Goliad counties to help with community preparations and response to the slower moving, yet still dangerous, river flooding possibilities for these southern basin communities.
Finally, since government collaboration and funding will not likely be able to solve all flooding challenges, it is also recommended that individuals learn more about flood risk in their area. The River Authority’s Floodplain Viewer engages users in an interactive floodplain map, displaying FEMA’s National Flood Hazard Layer data. The Risk MAP viewer created by the River Authority allows a property owner to determine the level of flood risk across the life of the 30-year mortgage. The River Authority encourages homeowners to assess their home’s flood risk, and for those interested in learning more, the River Authority has information available to the public about the science of flood management and our flood risk engineering studies.