
While all the metrics in the San Antonio River Basin Report Card have overlapping correlation to the safe, clean, enjoyable creeks and rivers aspects of the River Authority’s mission, the Swimming Standard grade is primarily related to the clean and enjoyable aspects.
The quality of life and health of citizens who live in the River Authority’s District can be improved through having recreational access along creeks and rivers. With more access, people can develop a greater appreciation for the natural resources and quality of life benefits provided by the San Antonio River and its tributaries. This appreciation will lead to an awareness of the issues affecting the river promoting increased preservation and conservation of these resources by individuals, businesses, and government.
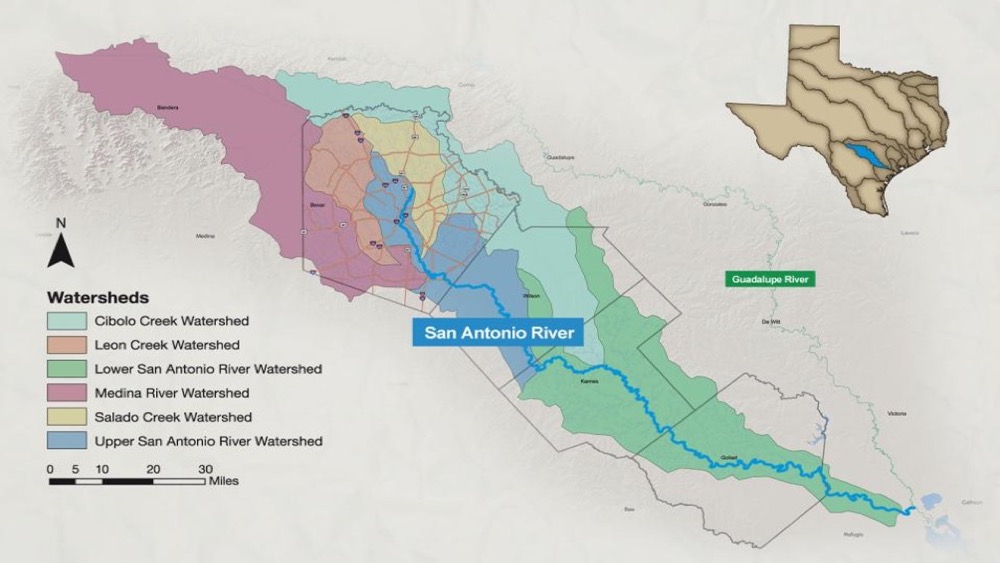
The 4,194 square miles of watershed that feed the San Antonio River contain diverse sources of contaminants that may affect water quality in the river and its tributaries. Reducing these sources to achieve a water quality standard in the creeks and rivers that is consistently safe for direct human contact (i.e. recreation) would generate lasting and recognized improvements to the health of the overall basin.
To determine suitable recreation use, the River Authority measures Escherichia coli (E. coli) bacteria as an indicator of recent fecal contamination to area waterways. E. coli comes from the gut of warm-blooded animals, and while most strains are not typically harmful to humans, it is a measure of recent fecal contamination. Fecal matter may contain disease-causing bacteria, viruses, or protozoans. Typical sources of E. coli include wildlife, domestic animals, and humans. When it rains, E. coli levels in our creeks and rivers rise exponentially. This is because as it rains, stormwater runoff washes over the land, carrying fecal matter into nearby creeks and rivers.
Grade for 2022:
D+
How is this being measured?
The River Authority has an extensive water quality monitoring program that compiles and reports data on a variety of contaminants in the water to the State. For this metric, the contaminant of importance is E. coli bacteria. The River Authority uses a geometric mean to determine the type of contact recreation at a given location. It is an average of water quality testing results over time. The geometric mean criterion for E. coli for the Primary Contact Recreation 1 Standard is less than or equal to 126 MPN (most probable number) per 100 mL. This regulatory surface water standard set by the Texas Commission on Environmental Quality (TCEQ) refers to activities which are presumed to involve a significant risk of water ingestion, such as swimming and wading by children. Thus, for the sake of simplicity in this basin report card, we have decided to use an informal name for this metric and will call it the Swimming Standard rather than using the formal regulatory name of Primary Contact Recreation 1 Standard.
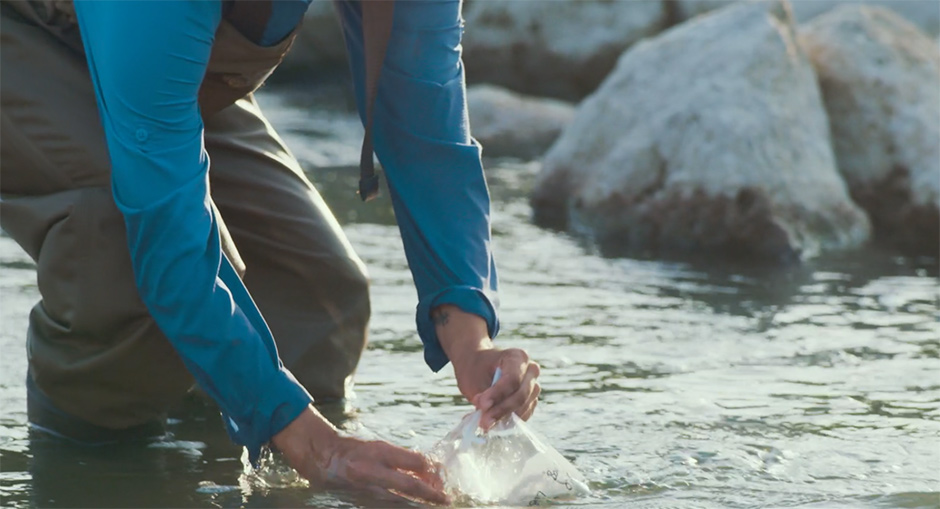
The grade for this metric uses the water quality monitoring data collected by the River Authority. The past five years of data is used to determine this grade by dividing the number of water quality monitoring sites that meet the Primary Contact Recreation 1 Standard by the total number of sites monitored in the basin and multiplying that number by 100. Therefore, the grade for this metric is based on the percentage of monitoring sites that meet the regulatory Primary Contact Recreation 1 Standard (i.e., Swimming Standard). It is important to note that 76 monitoring stations were identified last year (2020-2021) and 71 monitoring sites this year.
Explanation of the Grade
Based on data from the River Authority’s Water Quality – Bacteria Dashboard there are 27 sites meeting the Primary Contact Recreation 1 Standard out of 71 total sites.
- 27/71 x 100 = 38.0%
Grade: D+
Key Findings
The data and corresponding basin report card grade indicate that E. coli bacteria levels monitored in the San Antonio River often exceed the state surface water quality geometric mean criterion for the Primary Contact Recreation 1 Standard. A deeper dive into the data shows that sites that have the most difficulty meeting water quality standards are located within urbanized Bexar County.
Annual rainfall rates also impact this report card grade. (Note: The River Authority’s fiscal year runs from July 1 to June 30.) Years that have more rainfall are likely to have an increase in E. coli levels as bacteria levels tend to rise dramatically in the river following rain events, particularly in urbanized areas with large amounts of impervious cover. These high levels of bacteria have a significant impact when determining the geometric mean for the water quality standard.
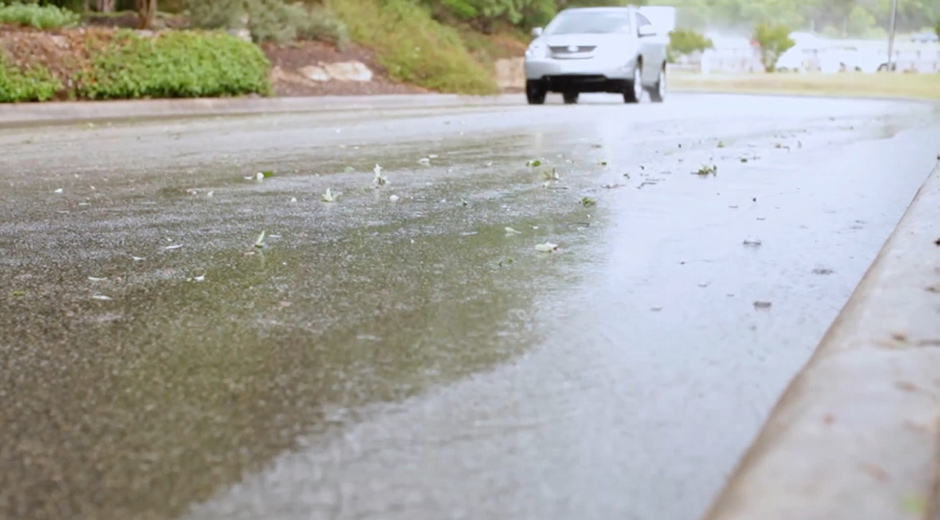
It is not surprising that the water quality monitoring sites in urban areas have higher bacteria readings. As more natural surfaces are paved and developed, less water percolates into the ground and more water instead goes over impervious surfaces and into storm drains, picking up pollutants and carrying them to creeks and rivers. The untreated rainwater that goes into storm drains and directly to our creeks and rivers is known as stormwater runoff. The pollutants picked up by stormwater include, but are not limited to, oil, fertilizers, bacteria, heavy metals, gasoline, and sediment. Stormwater runoff (or non-point source pollution) is the most significant threat to water quality degradation in the San Antonio River Basin. It is also the most difficult to manage.
The problems associated with stormwater runoff are not confined solely to urban areas. Pollutants can negatively impact waterways when rain falls on farm and ranchland where fertilizers, animal feed, and animal wastes are not adequately buffered from creeks and rivers.
Recommended Actions
There is much work to be done locally if our community is interested in having water quality that regularly meets the Primary Contact Recreation 1 Standard. Even if you are not personally interested in swimming or wading in the San Antonio River, it is the opinion of the River Authority that each resident of the basin be river proud and seek ways to help improve the quality of the river basin.
Each person can help by reporting any sewer overflows or blockages to the appropriate agencies. If you are unsure who the appropriate wastewater treatment provider is, please contact the River Authority’s environmental investigations staff. In addition to sewer overflows or blockages, you can also report to our environmental investigators fish kills, habitat destruction, floodplain and encroachment violations, and anything illegal or hazardous being dumped within the San Antonio River Basin.
Our next recommendation is to advance the use of sustainable, green infrastructure practices within the rapidly urbanizing communities throughout the basin. Historically, the goal of urban drainage infrastructure was to convey water quickly away from a developed site to prevent localized flooding. Traditional engineering approaches to stormwater management are designed for large storm events and convey runoff rapidly from developed, impervious surfaces into drainage systems, discharging large volumes of stormwater and pollutants to downstream receiving creeks and rivers. Such conveyance systems were engineered to direct flows from impervious surfaces (e.g., streets, parking lots, sidewalks, and buildings) to curbs, gutters, storm drains, and ultimately, to nearby creeks and rivers.
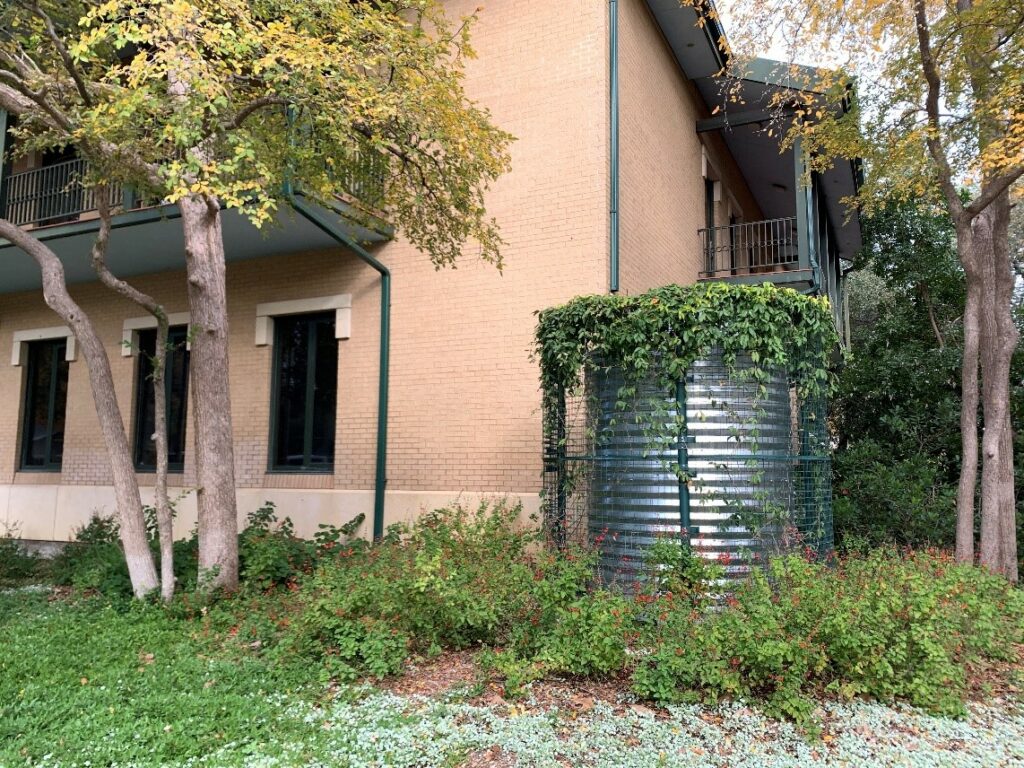
Unlike traditional urban drainage infrastructure, green infrastructure is a design and land development approach that alleviates negative stormwater runoff impacts by performing natural or nature-mimicking functions that slow, capture, and/or clean stormwater runoff—like nature intended. When stormwater is treated using green infrastructure, like the soils, rocks, plants, and their root systems of undisturbed natural surfaces, bacteria and pollutants are filtered out before they reach nearby creeks and rivers and the runoff is slowed down which helps reduce the bacteria- and pollution-carrying sediments as well as the stormwater velocities, which can cause erosion damage and add to flash-flooding.
The River Authority is the champion promoting the benefits of green infrastructure approaches that reduce the velocity of and filter pollutants from stormwater to ensure that the sustainability of our natural waterways is prioritized as we move toward the future. The River Authority’s work to mitigate future threats to our waterways is more critical than ever as communities within the basin are growing rapidly – the population in the San Antonio region is anticipated to increase by over 1 million people by 2040. In a region whose history and culture are linked to its natural resources, protecting our creeks and rivers as we grow demonstrates stewardship for these vital resources.
We need your help to advance the use green infrastructure! So, our most important recommendation to help improve this grade is for each resident of the basin to take an action to support sustainability. In addition to learning about sustainability, each individual action – like moving your gutter downspout to drain onto your yard instead of your driveway or building a rain garden at your home – can add up and help make a difference for the health of the river. You can also join the River Warrior volunteers to actively participate in ecosystem restoration projects as well as attend trainings and educational events to gain knowledge on green infrastructure strategies to become river protection ambassadors. Lastly, you are encouraged to use your voice to support green infrastructure. Please follow and tag the River Authority on Facebook, Twitter, and Instagram and use #BeRiverProud to tell us your vision for the future of the San Antonio River and how you will help make that vision a reality, and be sure to tell your elected officials as well.
Grade for 2021:
D+
How is this being measured?
The River Authority has an extensive water quality monitoring program that compiles and reports data on a variety of contaminants in the water to the State. For this metric, the contaminant of importance is E. coli bacteria. The River Authority uses a geometric mean to determine the type of contact recreation at a given location. It is an average of water quality testing results over time. The geometric mean criterion for E. coli for the Primary Contact Recreation 1 Standard is 126 MPN per 100 mL. This regulatory surface water standard set by the Texas Commission on Environmental Quality (TCEQ) refers to activities which are presumed to involve a significant risk of water ingestion, such as swimming and wading by children. Thus, for the sake of simplicity in this basin report card, we have decided to use an informal name for this metric and will call it the Swimming Standard rather than using the formal regulatory name of Primary Contact Recreation 1 Standard.
The grade for this metric uses the water quality monitoring data collected by the River Authority. The past five years of data is used to determine this grade by dividing the number of water quality monitoring sites that meet the Primary Contact Recreation 1 Standard by the total number of sites monitored in the basin and multiplying that number by 100. Therefore, the grade for this metric is based on the percentage of monitoring sites that meet the regulatory Primary Contact Recreation 1 Standard (i.e., Swimming Standard). It is important to note that 72 monitoring stations were identified last year (2019-2020) and 76 monitoring sites this year. New stations and increase in measuring routine account for the additions.
Explanation of the Grade
Based on data from the River Authority’s Water Quality – Bacteria Dashboard there are 28 sites meeting the Primary Contact Recreation 1 Standard out of 76 total sites.
Grade: D+
(28/76 x 100 = 36.8%)
Key Findings
The data and corresponding basin report card grade indicate that E. coli bacteria levels monitored in the San Antonio River often exceed the state surface water quality geometric mean criterion for the Primary Contact Recreation 1 Standard. A deeper dive into the data shows that sites that have the most difficulty meeting water quality standards are located within urbanized Bexar County.
Annual rainfall rates also impact this report card grade. (Note: The River Authority’s fiscal year runs from July 1 to June 30.) Years that have more rainfall are likely to have an increase in E. coli levels as bacteria levels tend to rise dramatically in the river following rain events, particularly in urbanized areas with large amounts of impervious cover. These high levels of bacteria have a significant impact when determining the geometric mean for the water quality standard.
It is not surprising that the water quality monitoring sites in urban areas have higher bacteria readings. As more natural surfaces are paved and developed, less water percolates into the ground and more water instead goes over impervious surfaces and into storm drains, picking up pollutants and carrying them to creeks and rivers. The untreated rainwater that goes into storm drains and directly to our creeks and rivers is known as stormwater runoff. The pollutants picked up by stormwater include, but are not limited to, oil, fertilizers, bacteria, heavy metals, gasoline, and sediment. Stormwater runoff (or non-point source pollution) is the most significant threat to water quality degradation in the San Antonio River Basin. It is also the most difficult to manage.
The problems associated with stormwater runoff are not confined solely to urban areas. Pollutants can negatively impact waterways when rain falls on farm and ranchland where fertilizers, animal feed, and animal wastes are not adequately buffered from creeks and rivers. Additionally, bacteria levels are a challenge for rivers nationwide. The National Rivers and Streams Assessment, which was last conducted by the Environmental Protect Agency (EPA) in 2013/14, found that bacteria exceeded “thresholds protective of human health in nearly 1 out of every 4 river and stream miles.” (Note: this EPA study used Enterococci as the bacteria indicator instead of E. coli, and the EPA is currently conducting a new 2018/19 National Rivers and Streams Assessment.)
Recommended Actions
While the San Antonio River Basin is faring better with regards to bacteria levels as compared to the national average, there is still much work to be done locally if our community is interested in having water quality that regularly meets the Primary Contact Recreation 1 Standard. Even if you are not personally interested in swimming or wading in the San Antonio River, it is the opinion of the River Authority that each resident of the basin Be River Proud and seek ways to help improve the quality of the river basin.
Each person can help by reporting any sewer overflows or blockages to the appropriate agencies. If you are unsure who the appropriate wastewater treatment provider is, please contact the River Authority’s environmental investigations staff. In addition to sewer overflows or blockages, you can also report to our environmental investigators fish kills, habitat destruction, floodplain and encroachment violations, and anything illegal or hazardous being dumped within the San Antonio River Basin.
Our next recommendation is to advance the use of sustainable, green infrastructure practices within the rapidly urbanizing communities throughout the basin. Historically, the goal of urban drainage infrastructure was to convey water quickly away from a developed site to prevent localized flooding. Traditional engineering approaches to stormwater management are designed for large storm events and convey runoff rapidly from developed, impervious surfaces into drainage systems, discharging large volumes of stormwater and pollutants to downstream receiving creeks and rivers. Such conveyance systems were engineered to direct flows from impervious surfaces (e.g., streets, parking lots, sidewalks, and buildings) to curbs, gutters, storm drains, and ultimately, to nearby creeks and rivers.
Unlike traditional urban drainage infrastructure, green infrastructure, is a design and land development approach that alleviates negative stormwater runoff impacts by performing natural or nature-mimicking functions that slow, capture, and/or clean stormwater runoff—like nature intended. When stormwater is treated using green infrastructure, like the soils, rocks, plants, and their root systems of undisturbed natural surfaces, bacteria and pollutants are filtered out before they reach nearby creeks and rivers and the runoff is slowed down which helps reduce the bacteria- and pollution-carrying sediments as well as the stormwater velocities, which can cause erosion damage and add to flash-flooding.
The River Authority is the champion promoting the benefits of green infrastructure approaches that reduce the velocity of and filter pollutants from stormwater to ensure that the sustainability of our natural waterways is prioritized as we move toward the future. The River Authority’s work to mitigate future threats to our waterways is more critical than ever as communities within the basin are growing rapidly – the population in the San Antonio region is anticipated to increase by over 1 million people by 2040. In a region whose history and culture are linked to its natural resources, protecting our creeks and rivers as we grow demonstrates stewardship for these vital resources.
We need your help to advance the use green infrastructure! So, our most important recommendation to help improve this grade is for each resident of the basin to take an action to support sustainability. In addition to learning about sustainability, each individual action – like moving your gutter downspout to drain onto your yard instead of your drive way or building a rain garden at your home – can add up and help make a difference for the health of the river. You can also join the River Warrior volunteers to actively participate in ecosystem restoration projects as well as attend trainings and educational events to gain knowledge on green infrastructure strategies to become river protection ambassadors. Lastly, you are encouraged to use your voice to support green infrastructure. Please follow and tag the River Authority on Facebook, Twitter, and Instagram and use #BeRiverProud to tell us your vision for the future of the San Antonio River and how you will help make that vision a reality. Be sure to tell your elected officials as well.
Grade for 2020:
D
How is this being measured?
The River Authority has an extensive water quality monitoring program that compiles and reports data on a variety of contaminants in the water to the State. For this metric, the contaminant of importance is E. coli bacteria. The River Authority uses a geometric mean to determine the type of contact recreation at a given location. It is an average of water quality testing results over time. The geometric mean criterion for E. coli for the Primary Contact Recreation 1 Standard is 126 MPN per 100 mL. This regulatory surface water standard set by the Texas Commission on Environmental Quality (TCEQ) refers to activities which are presumed to involve a significant risk of water ingestion, such as swimming and wading by children. Thus, for the sake of simplicity in this basin report card, we have decided to use an informal name for this metric and will call it the Swimming Standard rather than using the formal regulatory name of Primary Contact Recreation 1 Standard.
The grade for this metric uses the water quality monitoring data collected by the River Authority. The past five years of data is used to determine this grade by dividing the number of water quality monitoring sites that meet the Primary Contact Recreation 1 Standard by the total number of sites monitored in the basin and multiplying that number by 100. Therefore, the grade for this metric is based on the percentage of monitoring sites that meet the regulatory Primary Contact Recreation 1 Standard (i.e. Swimming Standard).
Explanation of the Grade
Based on data from the River Authority’s Water Quality – Bacteria Dashboard there are 23 sites meeting the Primary Contact Recreation 1 Standard out of 72 total sites.
Grade: D
(23/72 x 100 = 31.9%)
Key Findings
The data and corresponding basin report card grade indicate that E. coli bacteria levels monitored in the San Antonio River often exceed the state surface water quality geometric mean criterion for the Primary Contact Recreation 1 Standard. A deeper dive into the data shows that sites that have the most difficulty meeting water quality standards are located within urbanized Bexar County.
Annual rainfall rates also impact this report card grade. (Note: The River Authority’s fiscal year runs from July 1 to June 30.) Years that have more rainfall are likely to have an increase in E. coli levels as bacteria levels tend to rise dramatically in the river following rain events, particularly in urbanized areas with large amounts of impervious cover. These high levels of bacteria have a significant impact when determining the geometric mean for the water quality standard.
It is not surprising that the water quality monitoring sites in urban areas have higher bacteria readings. As more natural surfaces are paved and developed, less water percolates into the ground and more water instead goes over impervious surfaces and into storm drains, picking up pollutants and carrying them to creeks and rivers. The untreated rainwater that goes into storm drains and directly to our creeks and rivers is known as stormwater runoff. The pollutants picked up by stormwater include, but are not limited to, oil, fertilizers, bacteria, heavy metals, gasoline and sediment. Stormwater runoff (or non-point source pollution) is the most significant threat to water quality degradation in the San Antonio River Basin. It is also the most difficult to manage.
The problems associated with stormwater runoff are not confined solely to urban areas. Pollutants can negatively impact waterways when rain falls on farm and ranchland where fertilizers, animal feed, and animal wastes are not adequately buffered from creeks and rivers. Additionally, bacteria levels are a challenge for rivers nationwide. The National Rivers and Streams Assessment, which was last conducted by the Environmental Protect Agency (EPA) in 2008/09, found that bacteria exceeded “thresholds protective of human health in nearly 1 out of every 4 river and stream miles.” (Note: this EPA study used Enterococci as the bacteria indicator instead of E. coli, and the EPA is currently conducting a new 2018/19 National Rivers and Streams Assessment.)
Recommended Actions
While the San Antonio River Basin is faring better with regards to bacteria levels as compared to the national average, there is still much work to be done locally if our community is interested in having water quality that regularly meets the Primary Contact Recreation 1 Standard. Even if you are not personally interested in swimming or wading in the San Antonio River, it is the opinion of the River Authority that each resident of the basin be river porud and seek ways to help improve the quality of the river basin. Our first recommendation is for area residents to learn about ways they can improve the health of the river.
Each person can also help by reporting any sewer overflows or blockages to the appropriate agencies. If you are unsure who the appropriate wastewater treatment provider is, please contact the River Authority’s environmental investigations staff. In addition to sewer overflows or blockages, you can also report to our environmental investigators fish kills, habitat destruction, floodplain and encroachment violations, and anything illegal or hazardous being dumped within the San Antonio River Basin.
Our next recommendation is to advance the use of sustainable, green infrastructure practices within the rapidly urbanizing communities throughout the basin. Historically, the goal of urban drainage infrastructure was to convey water quickly away from a developed site to prevent localized flooding. Traditional engineering approaches to stormwater management are designed for large storm events and convey runoff rapidly from developed, impervious surfaces into drainage systems, discharging large volumes of stormwater and pollutants to downstream receiving creeks and rivers. Such conveyance systems were engineered to direct flows from impervious surfaces (e.g., streets, parking lots, sidewalks and buildings) to curbs, gutters, storm drains, and ultimately, to nearby creeks and rivers.
Unlike traditional urban drainage infrastructure, green infrastructure, is a design and land development approach that alleviates negative stormwater runoff impacts by performing natural or nature-mimicking functions that slow, capture, and/or clean stormwater runoff—like nature intended. When stormwater is treated using green infrastructure, similar to the soils, rocks, plants, and their root systems of undisturbed natural surfaces, bacteria and pollutants are filtered out before they reach nearby creeks and rivers and the runoff is slowed down which helps reduce the bacteria- and pollution-carrying sediments as well as the stormwater velocities, which can cause erosion damage and add to flash-flooding.
The River Authority is the champion promoting the benefits of green infrastructure approaches that reduce the velocity of and filter pollutants from stormwater to ensure that the sustainability of our natural waterways is prioritized as we move toward the future. The River Authority’s work to mitigate future threats to our waterways is more critical than ever as communities within the basin are growing rapidly – the population in the San Antonio region is anticipated to increase by over 1 million people by 2040. In a region whose history and culture is linked to its natural resources, protecting our creeks and rivers as we grow demonstrates stewardship for these vital resources.
We need your help to advance the use green infrastructure! So, our most important recommendation to help improve this grade is for each resident of the basin to take an action to support sustainability. In addition to learning about sustainability, each individual action – like moving your gutter downspout to drain onto your yard instead of your drive way or building a rain garden at your home – can add up and help make a difference for the health of the river. You can also join the River Warrior volunteers to actively participate in ecosystem restoration projects as well as attend trainings and educational events to gain knowledge on green infrastructure strategies to become river protection ambassadors. Lastly, you are encouraged to use your voice to support green infrastructure. Please follow and tag the River Authority on Facebook, Twitter, and Instagram and use #BeRiverProud to tell us your vision for the future of the San Antonio River and how you will help make that vision a reality, and be sure to tell your elected officials as well.