Last Updated on January 30, 2024
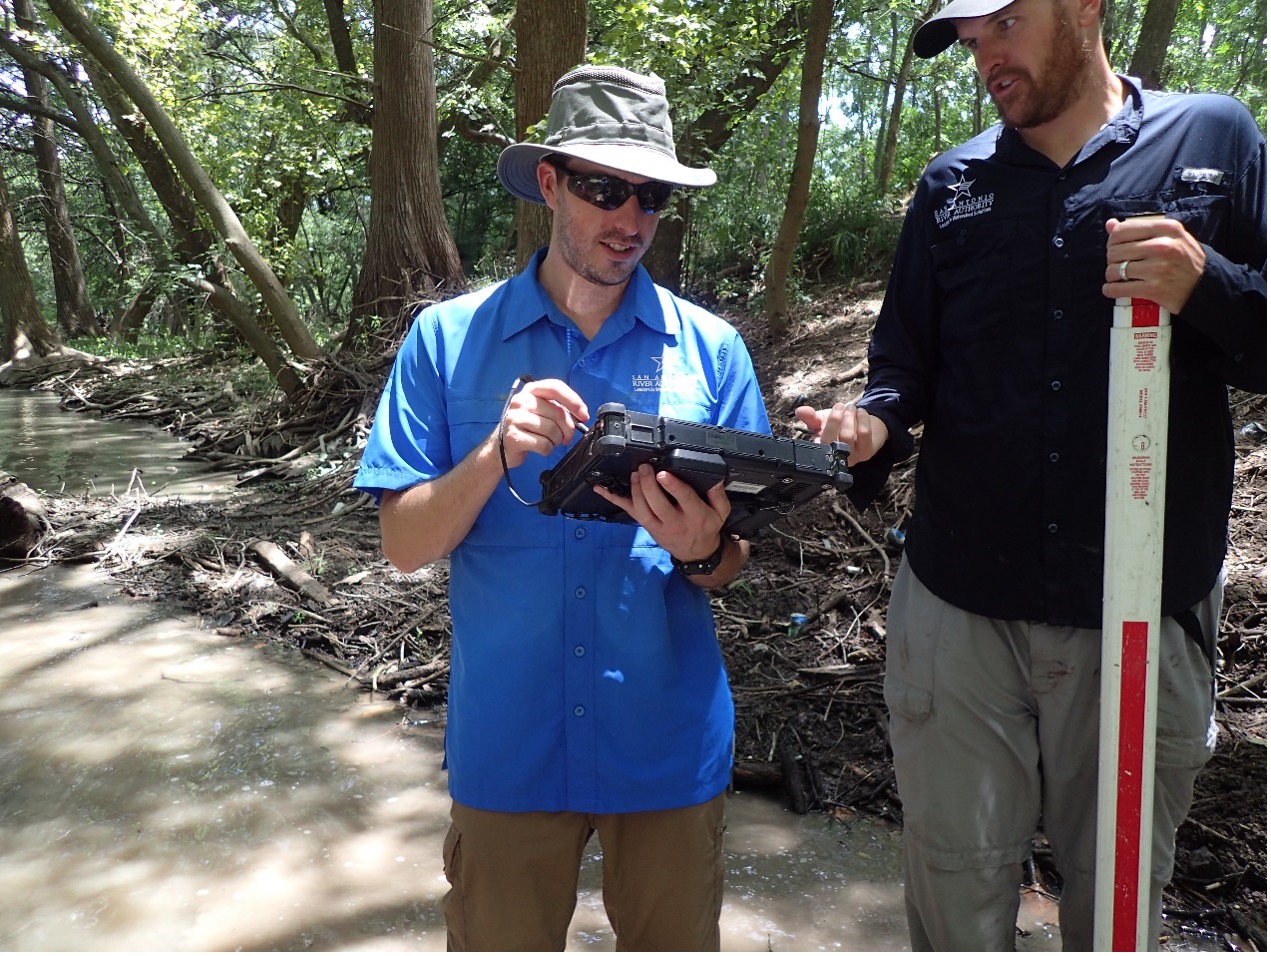
Now that we have explored the work done by the watershed monitoring and laboratory teams of the Environmental Sciences Department (ESD), we want to share with you what becomes of the data collected and generated by these teams and how it’s used to improve the safety, cleanliness, and enjoyability of creeks and rivers!
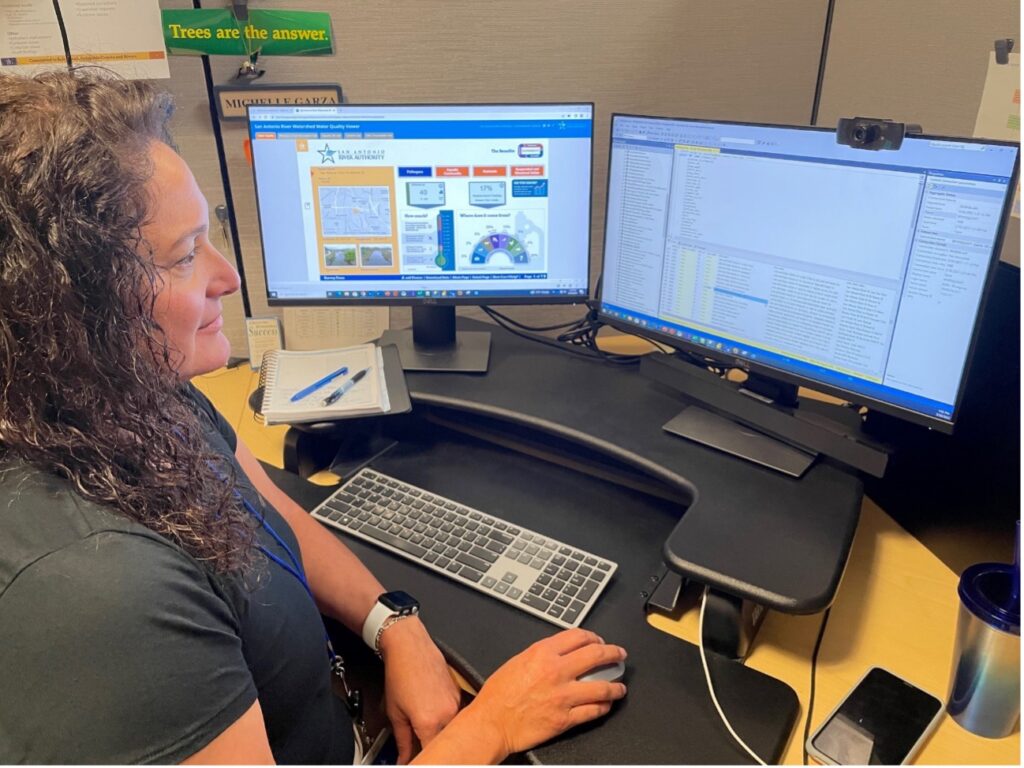
The ESD’s Data Management and Analysis (DMA) section manages water quality, habitat, biological, and ecological data generated by our scientists, aquatic biologists, and ecologists. Data flows through multiple reviews for accuracy, quality, and standardization. Ultimately, it will reside in trusted and documented storage platforms with accessibility for consumption and analysis.
The DMA also ensures data adheres to project data specifications and requirements and is delivered to regulatory entities such as the Texas Commission on Environmental Quality (TCEQ) and the National Park Service (NPS). It is also used by internal staff and partners working on water quality-related projects for applications such as:
- Basin Summary Reports: These documents aim to assist the public, stakeholders, and other agencies in developing a greater understanding of water quality conditions within the watershed, enabling entities to make informed water quality decisions.
- Water quality assessments: Assessments range from surface water quality, aquatic life, habitat conditions, and biodiversity to water quality impacts from rain events and pollutant removal by green infrastructure designed to treat stormwater. These assessments allow the River Authority and partners to monitor trends and identify areas of improvement and concern.
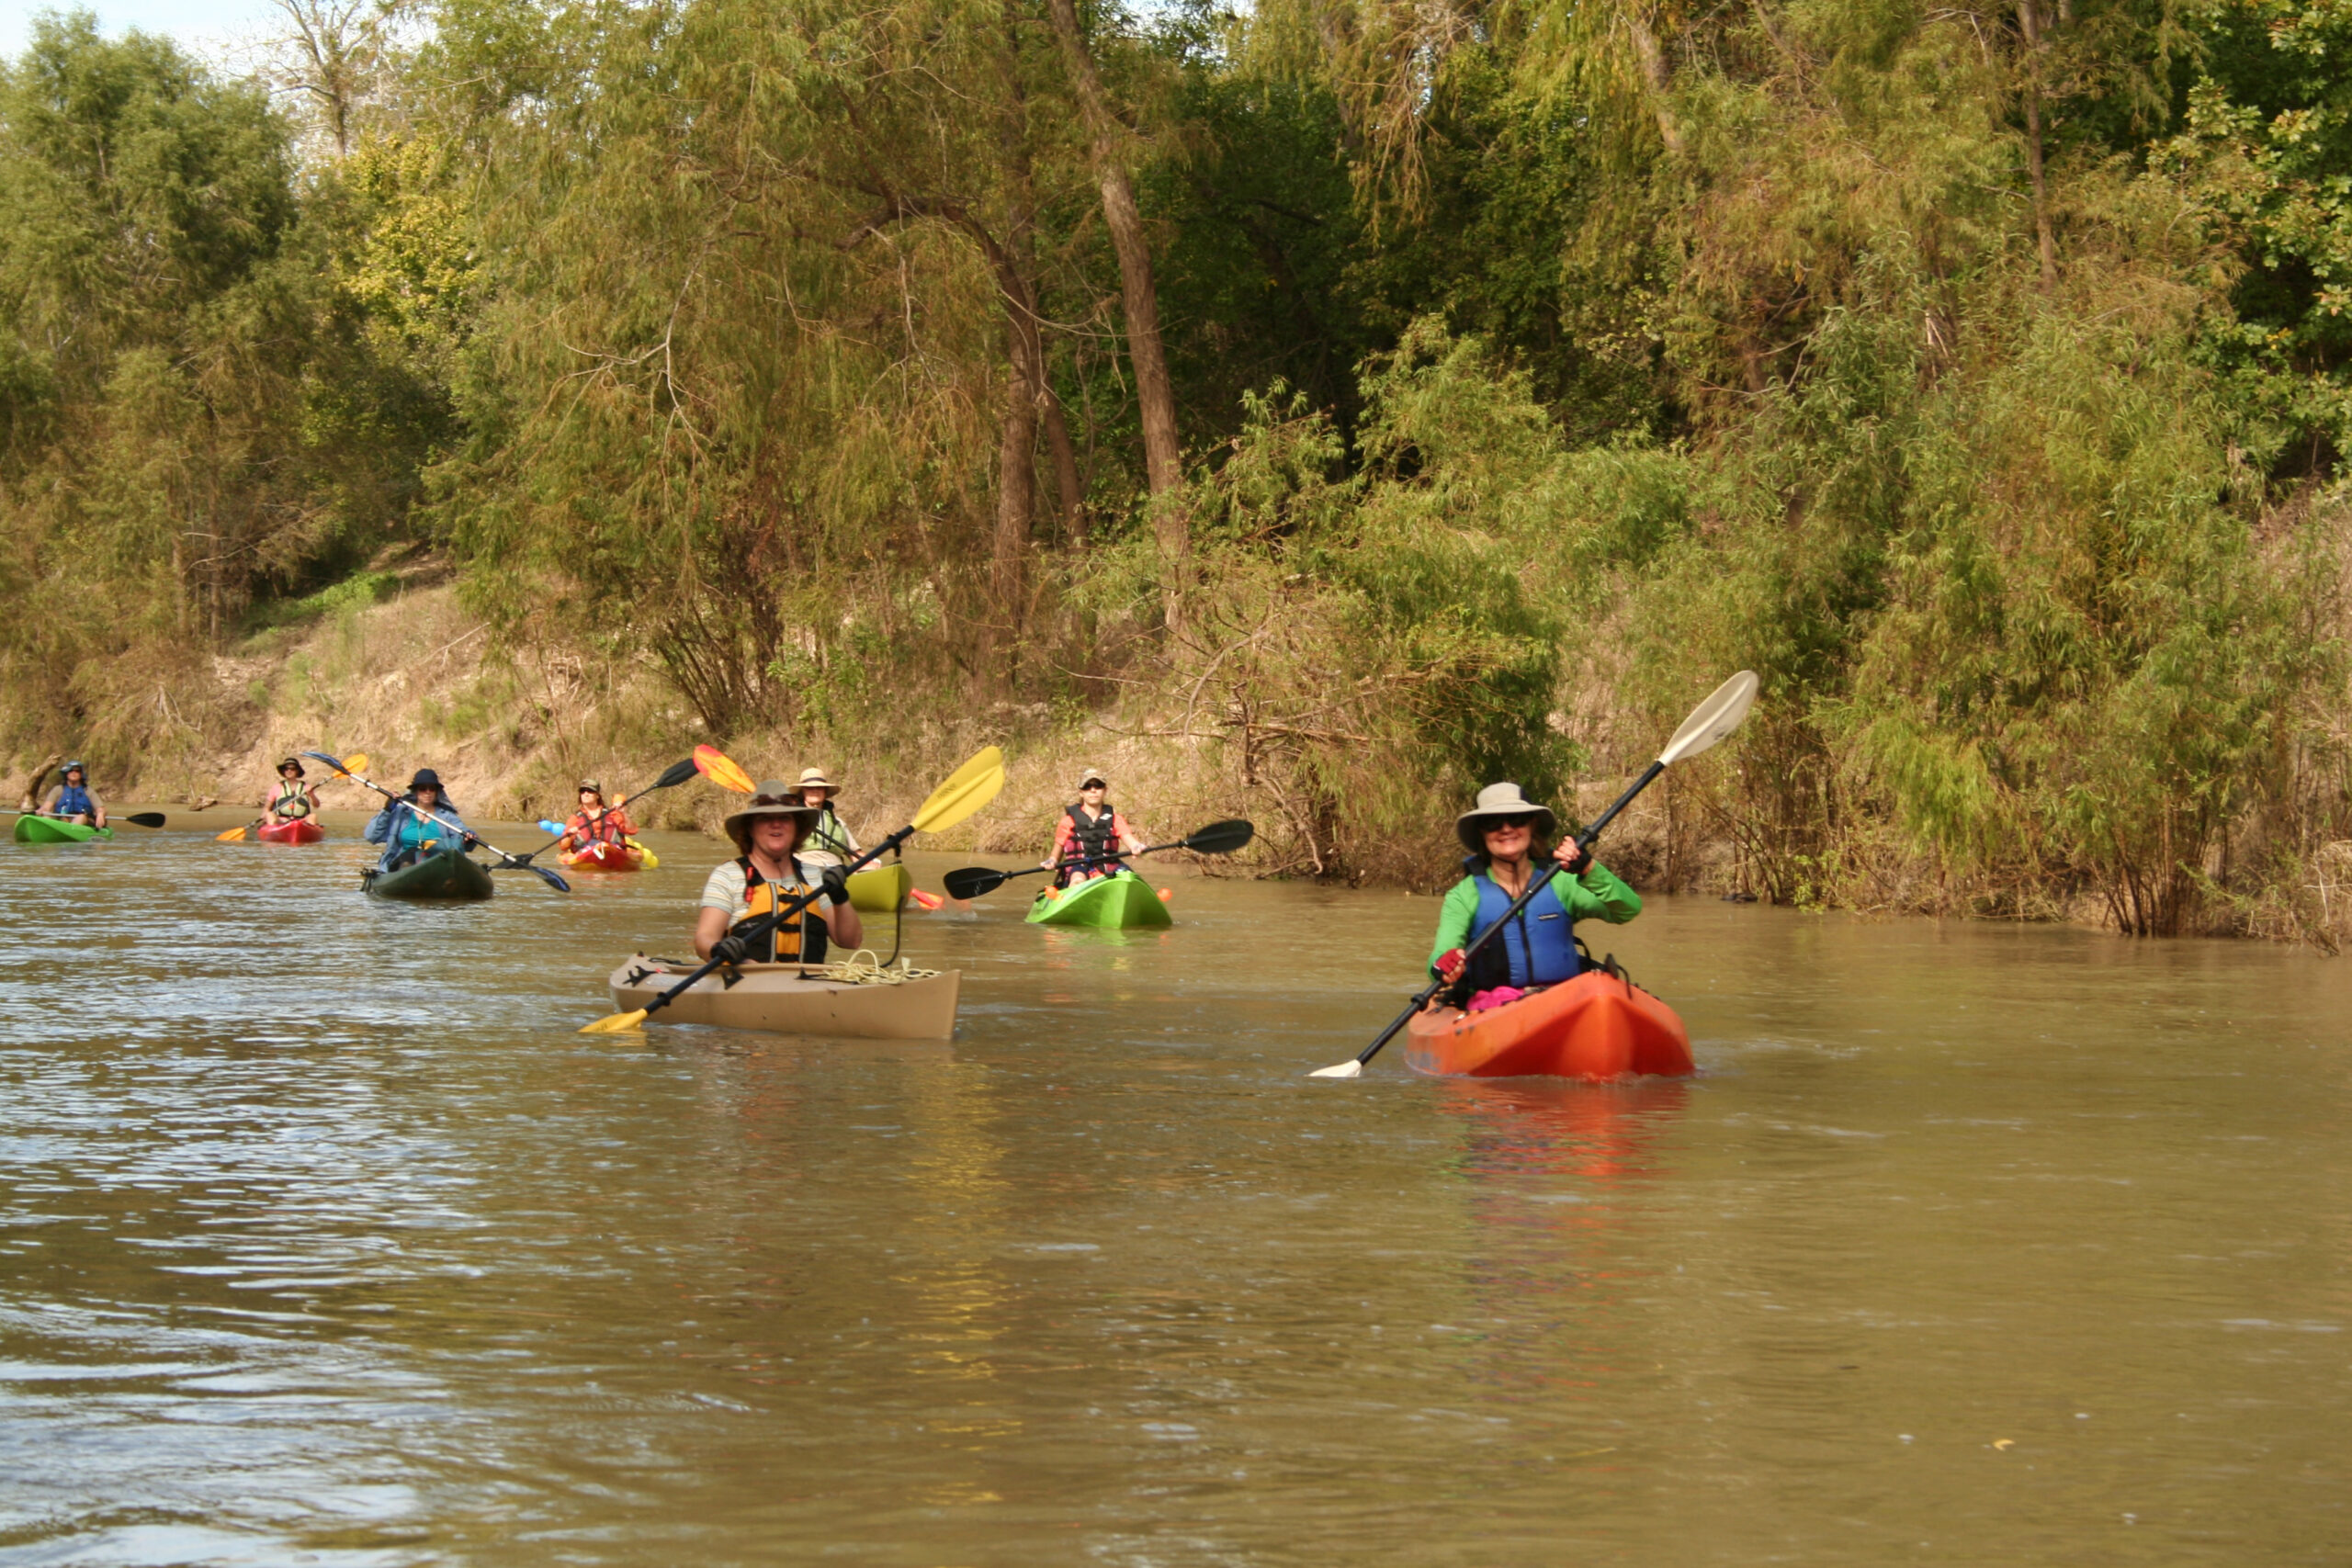
- Contact recreation usability: To improve our rivers’ enjoyability, scientists monitor bacteria levels at key points along the San Antonio River and determine if the levels meet the standards suitable for activities that pose a less significant risk of water ingestion, such as kayaking and paddling.
The great thing is that most of this data is available to the public through various platforms on our website!
The Water Quality Viewer is our online interactive visual platform of water quality data for over 250 monitoring stations throughout the watershed. It contains over 400 thousand results for monitoring events dating back to 1998. For example, the San Pedro Creek Culture Park monitoring site has nearly 900 E. coli results. Read the previous blog, “The Life of a Stormwater Sample: Part 2,” to learn what E. coli is and why tracking it is crucial!
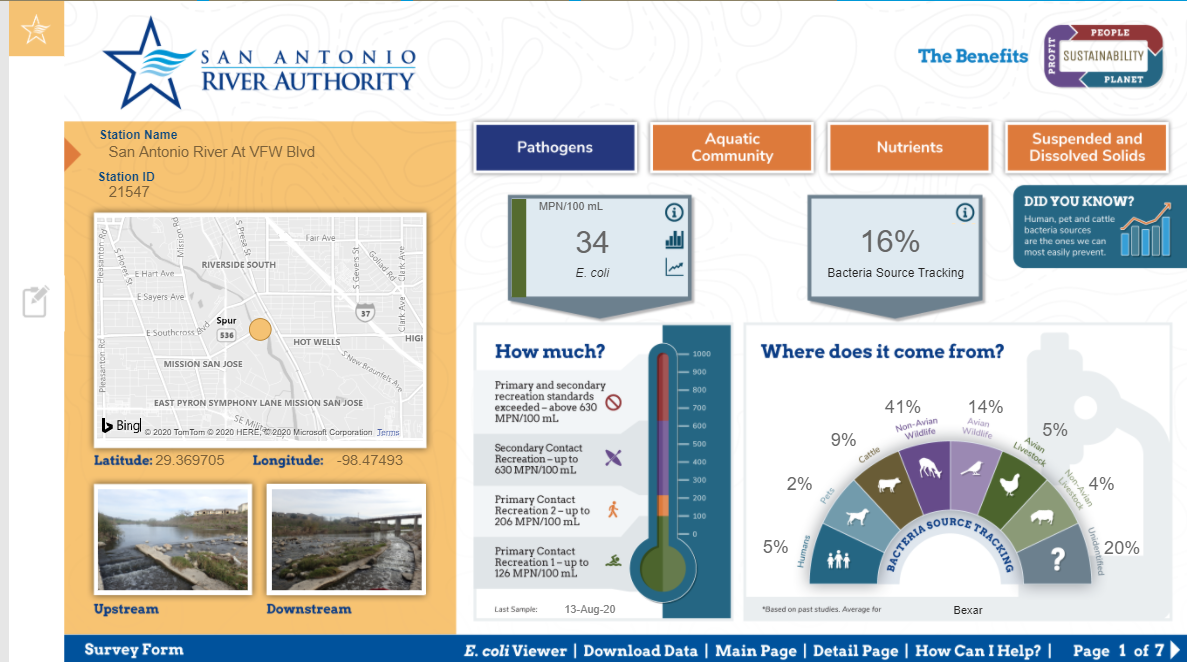
In this viewer, monitoring stations are identified on a map. Users can then zoom into an area of interest or select stations by county or watershed. Water quality data for pathogens (i.e., E. coli), aquatic communities, nutrients (e.g., nitrogen and phosphorus), and solids are presented for each station. The most recent results are displayed and assessed to water quality metrics with an explanation of the parameter and impacts on water quality and aquatic life. Charts are also available for the past 10 years, 5 years, and 1 year of data. Results are available for download by county, watershed, or station.
Another interactive tool available on our website is the Bacteria Dashboard. This dashboard displays the geometric mean of E. coli bacteria results for monitoring stations with sufficient collection data within the past five years. What is a geometric mean? A geometric mean is an average that multiplies all values of a data set and finds the root of the number. It can help determine the trends in data sets that have large fluctuations, such as bacteria levels. Each station is color-coded to indicate meeting primary (think swimming and wading) or secondary (think kayaking and paddleboarding) contact recreation standards.
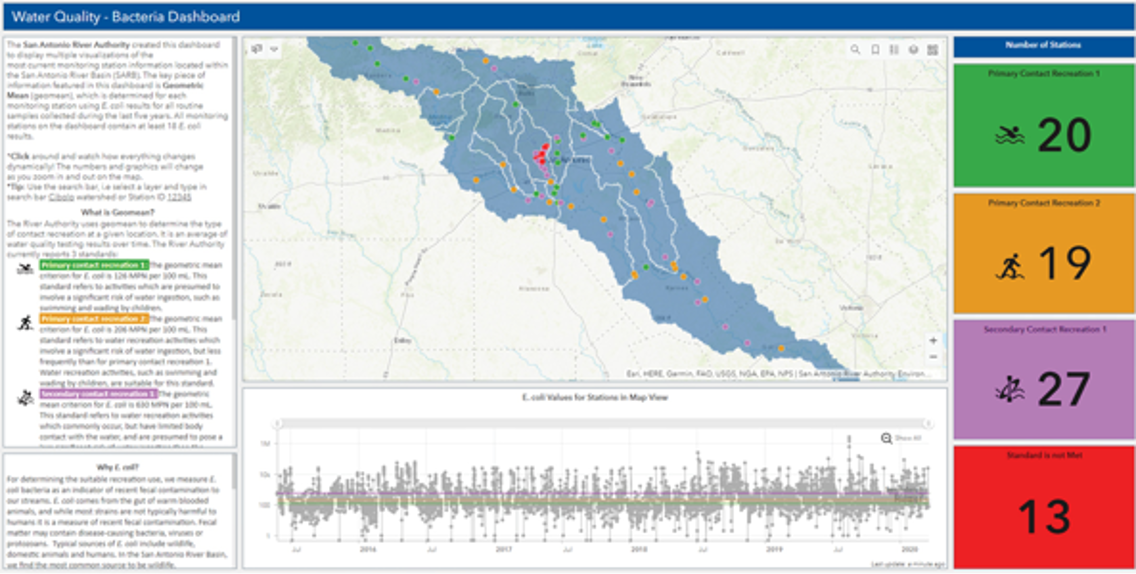
This data comes in handy for folks who wish to check out the level of E. coli before recreating on the river. Users can quickly assess 5-year bacteria levels throughout the watershed. Users can also compare the geometric means to the latest Texas Integrated Report, which does not include data from at least the most recent two years, to see if conditions have changed due to recent activity (construction, water treatment features, etc.) occurring within the water body.
Current E.coli levels at key points in our watershed can also be found on our Current Conditions and Closures webpage. Here, users can view the most recent bacteria level at 8 monitoring stations along our paddling trails and areas for recreational activities. E. coli values are charted for each station, along with stream flow and daily precipitation values. Samples at these sites are collected weekly, typically on Wednesday. They are displayed on the webpage by the end of the week- just in time for weekend warriors! The webpage also lets users view station history and download data if needed.
We hope this blog has inspired you to navigate our water quality data tools and learn more about the water quality conditions of our watershed and your areas of interest. As always, the ESD team welcomes feedback and suggestions. If you have questions or comments about these tools, please contact us!