
What is BexarFlood.org, WilsonFlood.org, KarnesFlood.org, and GoliadFlood.org?
Why does it flood?
Flooding History in San Antonio
The de la Garza House constructed near San Pedro Creek. The structure is believed to have been one of the oldest residences left standing in the city and is listed on the NRHP.
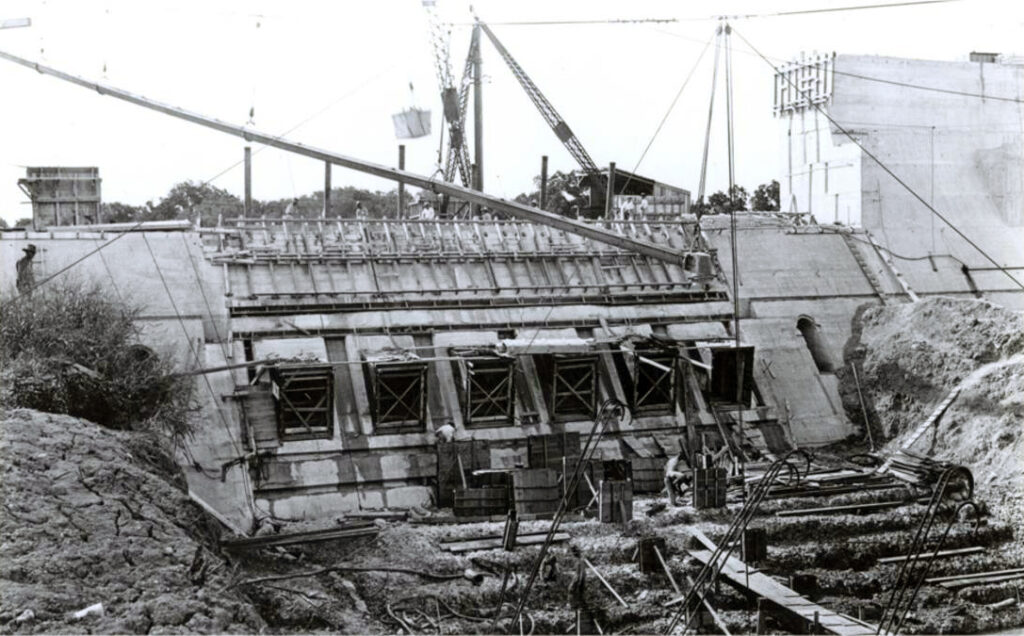
San Antonio River and area creeks flood. Following the flood, the first proposal was made to build a dam near the headwaters of the San Antonio River at the end of Olmos Creek.
City Council takes official action to reserve a clearly defined area for San Pedro Springs Park. The San Antonio Daily Ledger reported: A public square embracing an extent of fifty acres, has been set apart, above our town. From the heart of this square, leap forth, from God’s alembic, the clear waters of San Pedro.

The San Antonio River and area creeks flood.
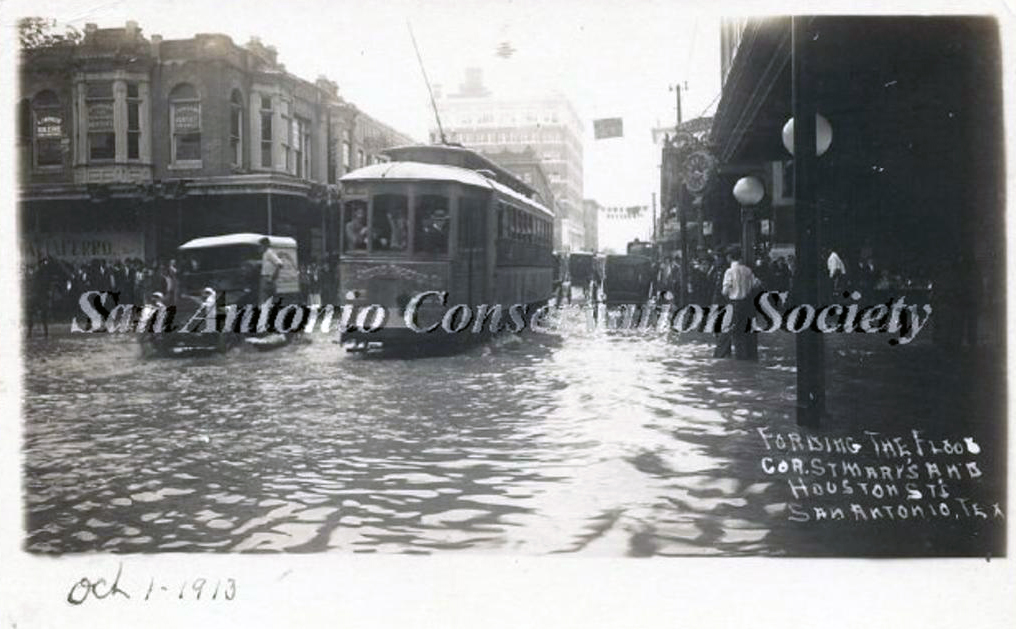
A record rainfall of over 7 inches in 24-hours caused major flooding along the San Antonio River, San Pedro Creek and Alazán creeks. Four lives were lost and significant damage occurred in downtown San Antonio estimated at $250,000 (almost $6.2 million in 2017 dollars).
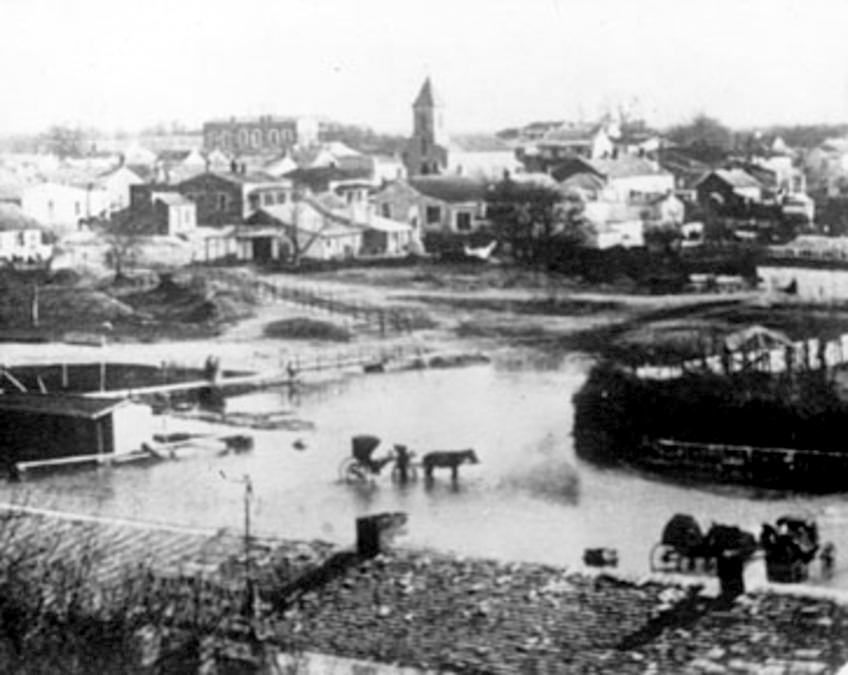
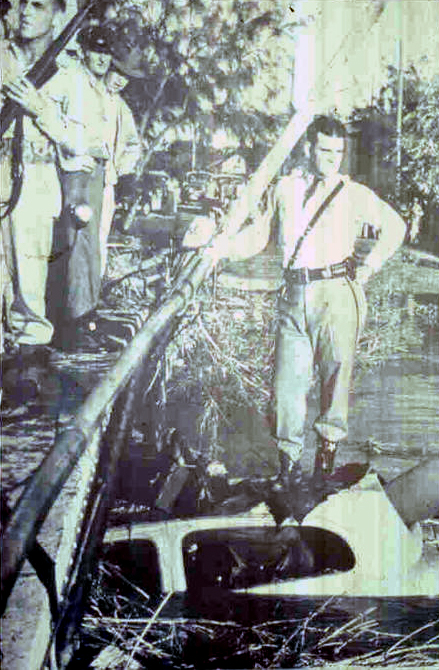
San Antonio historic flood kills 51 people and causes $3.7 million dollars in damages (over $52.1 million in 2017 dollars). The 7.38 inches officially recorded in San Antonio combined with amounts twice as heavy from higher ground to the north, sent a massive surge of water down the San Antonio River. All but four of the deaths occurred along the San Pedro and Alazán creeks.
June 28, 1929: Young architect, Robert H. H. Hugman, presents his plan for “The Shops of Romula and Aragon” to Mayor Chambers, two City Commissioners, property owners and civic leaders. The proposal endorses the bypass channel and recommends floodgates at the north end, a small dam at the south end and a tainter gate in the channel to check the flow and create pools of water. The Depression prevents any construction other than the bypass channel that was begun in 1926 and completed in 1930.
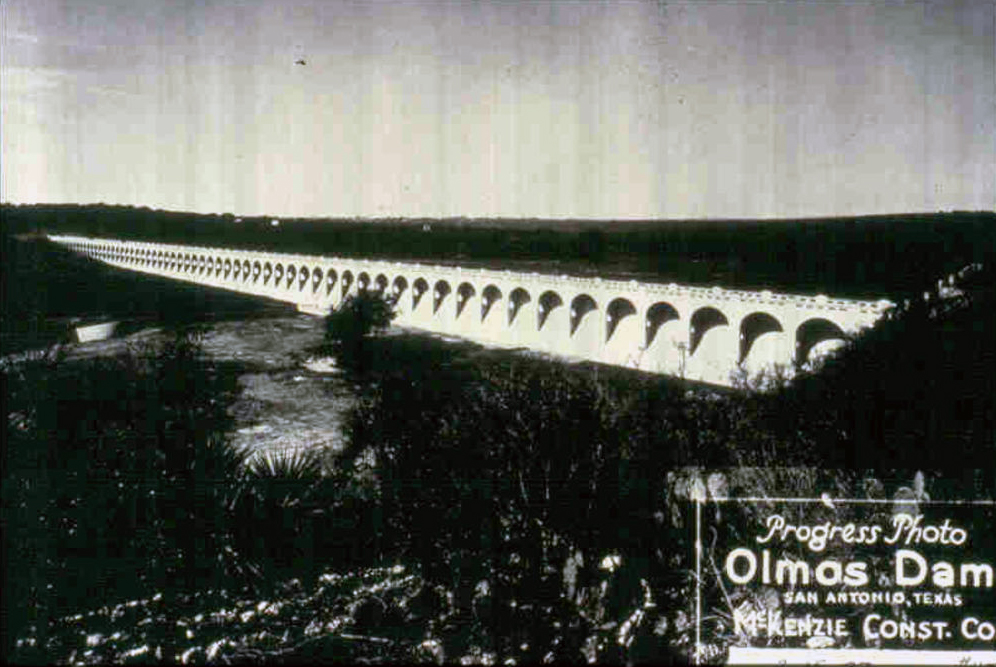
Following a storm, the Olmos Dam proved its worth by holding back 20 feet of water.
The San Antonio River and area creeks flood resulting in the loss of four lives.
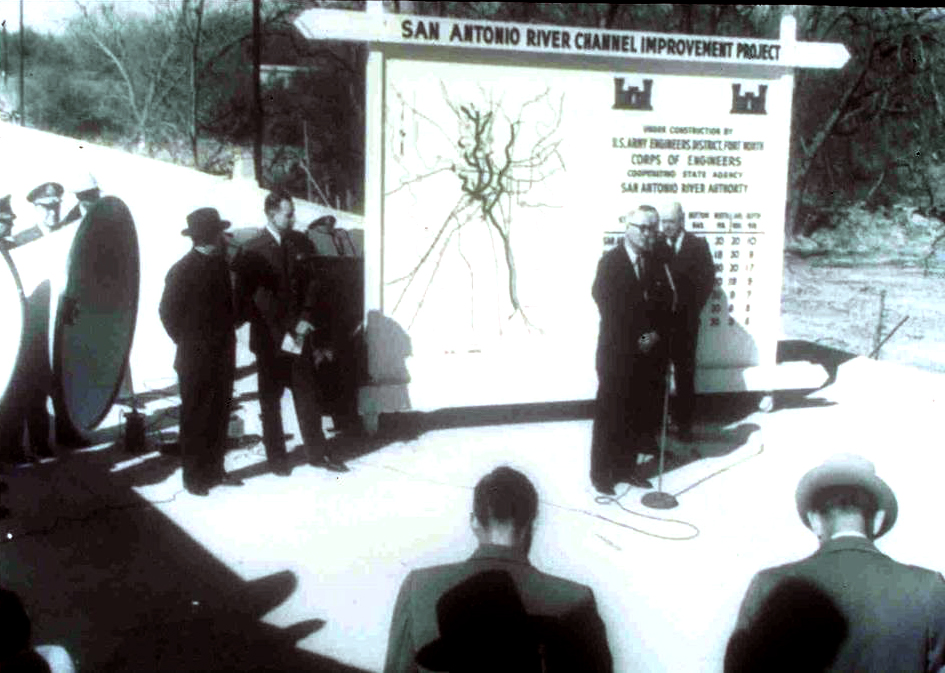
As a result of the flood of 1946, the U.S. Congress authorized the San Antonio River Channel Improvements Project (SACIP) allowing Bexar County and the San Antonio River Authority (SARA) to enter into a partnership with the U.S. Army Corps of Engineers to improve flood control along 31 miles of the San Antonio River and its tributaries. This involved realignment and channelization of the river system to move flood waters quickly away from urbanized areas. Construction began on the SACIP in 1958.
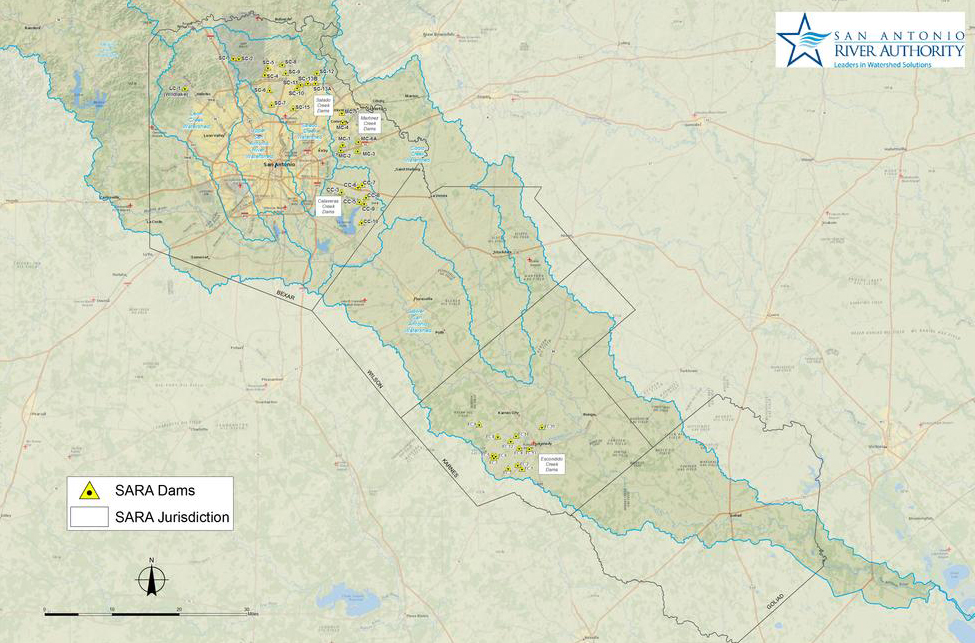
Nine dams along Calaveras Creek (Bexar County) and eleven along Escondido Creek (Karnes County) were completed and plans were underway for additional dams along Martinez Creek and Salado Creek (both in Bexar County).
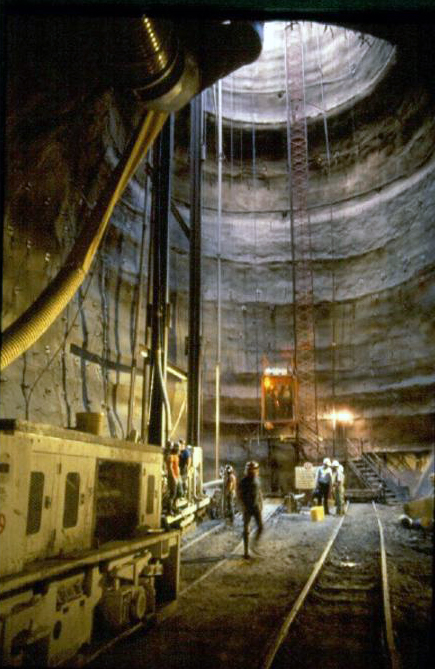
Completion of the San Antonio River Flood Tunnel designed to work with the Olmos Dam to protect downtown San Antonio from damage. The project includes an inlet facility located at Josephine Street and the San Antonio River, a 24-foot diameter, 3-mile long tunnel and an outlet site at Lone Star Boulevard. Ten months after completion of the tunnel, on October 17-18, 1998, south central Texas experienced record-breaking rainfall, and both the San Pedro Creek and the San Antonio River tunnels performed as designed, sparing downtown San Antonio from a devastating flood. In 1999, the tunnel project won the State of Texas Outstanding Civil Engineering Achievement Award from the American Society of Civil Engineers; it also received a national-level Award of Merit. A year later, it was one of four projects to receive the Federal Design Achievement Award from the National Endowment for the Arts (NEA), as well as an achievement award from the American Society of Civil Engineers in recognition of the San Antonio River Tunnel Inlet Site.
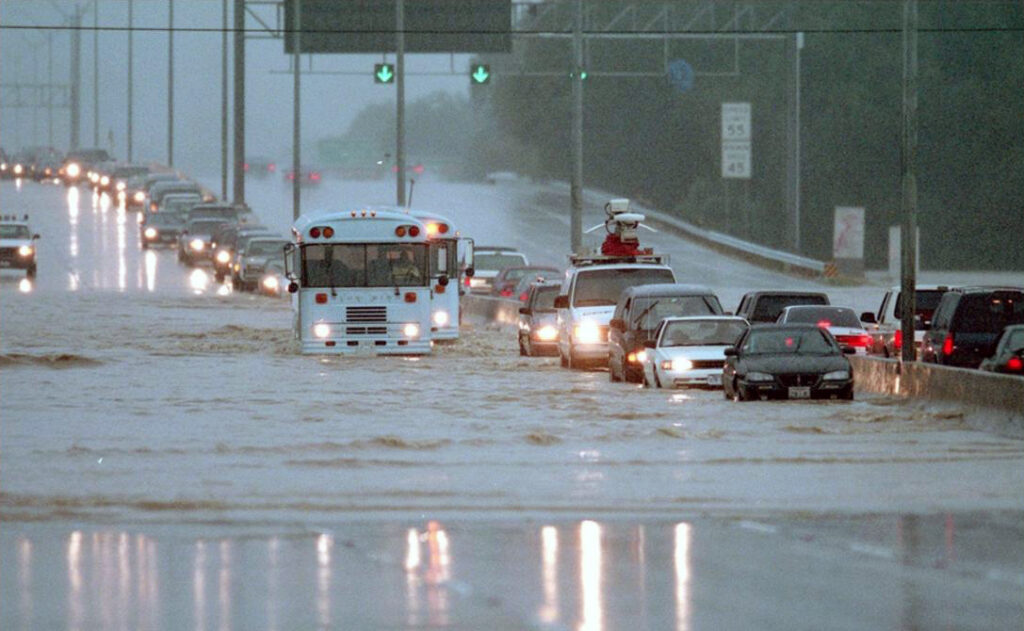
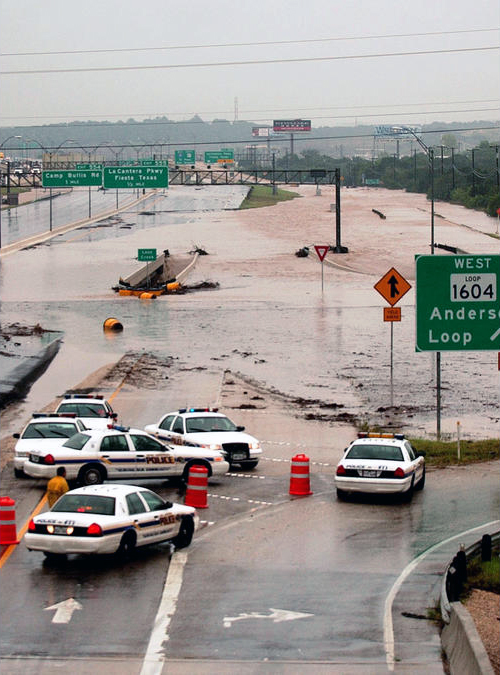
San Antonio suffers 100-year flood disaster.
Devastating floods hit the San Antonio River and area creeks.
San Antonio River Authority Partnerships