Última actualización el 30 de enero de 2024
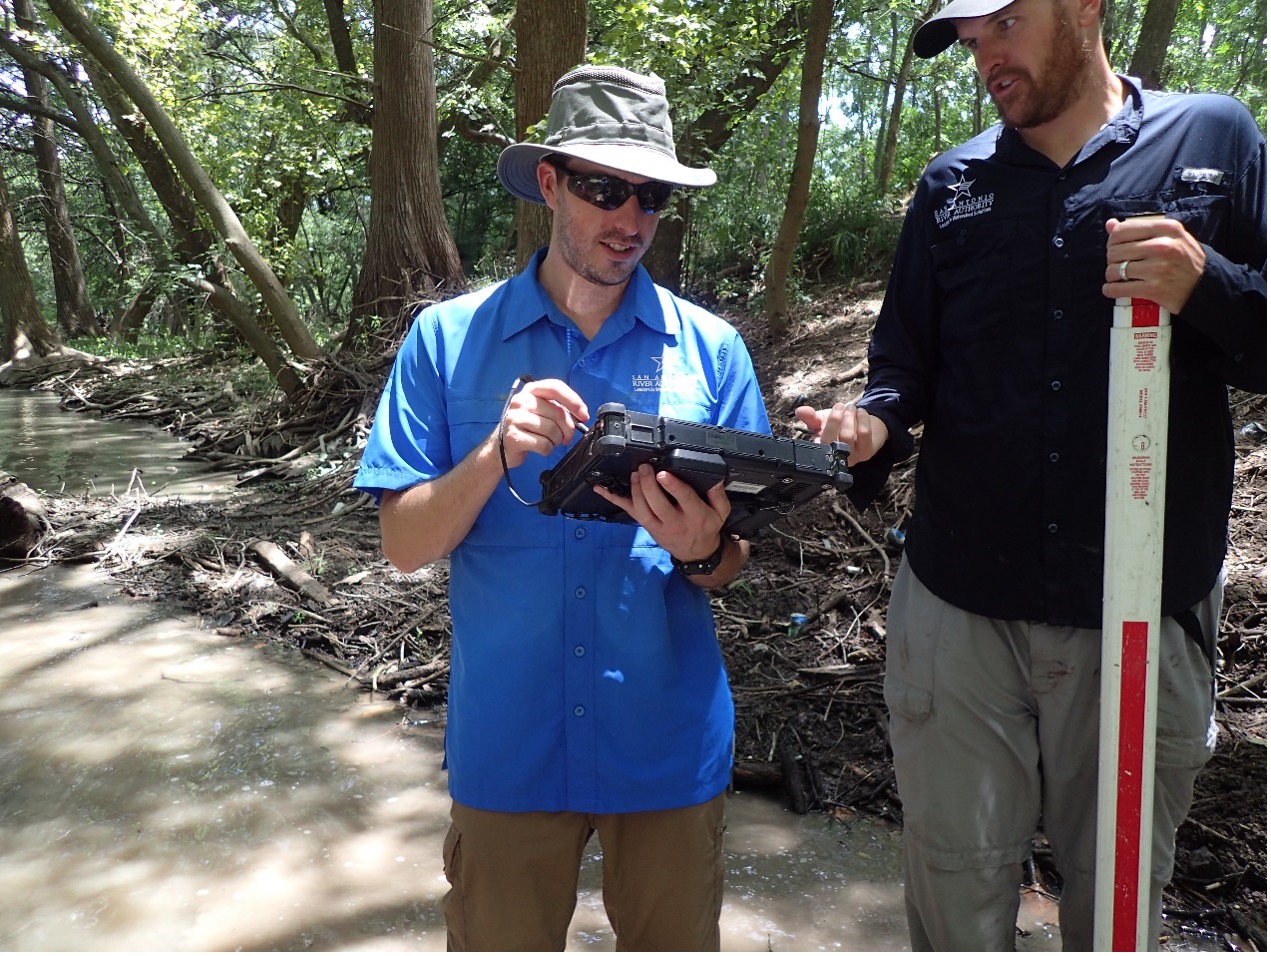
Ahora que hemos explorado el trabajo realizado por el equipos de laboratorio y monitoreo de cuencas del Departamento de Ciencias Ambientales (ESD), queremos compartir con usted qué pasa con los datos recopilados y generados por estos equipos y cómo se utilizan para mejorar la seguridad, la limpieza y el disfrute de arroyos y ríos.
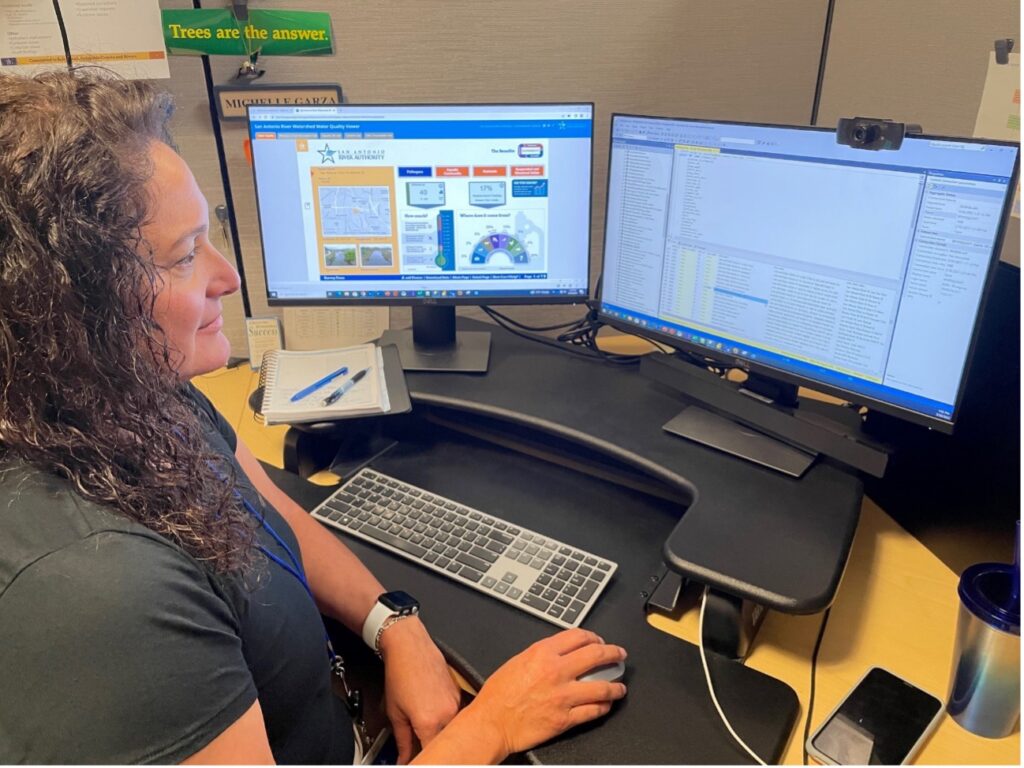
La sección de Análisis y Gestión de Datos (DMA) de ESD gestiona la calidad del agua, el hábitat, los datos biológicos y ecológicos generados por nuestros científicos, biólogos acuáticos y ecólogos. Los datos fluyen a través de múltiples revisiones para garantizar su precisión, calidad y estandarización. En última instancia, residirá en plataformas de almacenamiento confiables y documentadas con accesibilidad para consumo y análisis.
La DMA también garantiza que los datos cumplan con las especificaciones y requisitos de datos del proyecto y se entreguen a entidades reguladoras como la Comisión de Calidad Ambiental de Texas (TCEQ) y el Servicio de Parques Nacionales (NPS). También lo utiliza el personal interno y los socios que trabajan en proyectos relacionados con la calidad del agua para aplicaciones tales como:
- Informes resumidos de cuenca: Estos documentos tienen como objetivo ayudar al público, las partes interesadas y otras agencias a desarrollar una mayor comprensión de las condiciones de la calidad del agua dentro de la cuenca, permitiendo a las entidades tomar decisiones informadas sobre la calidad del agua.
- Evaluaciones de la calidad del agua: Las evaluaciones abarcan desde la calidad del agua superficial, la vida acuática, las condiciones del hábitat y la biodiversidad hasta los impactos en la calidad del agua derivados de las lluvias y la eliminación de contaminantes mediante infraestructura verde diseñada para tratar las aguas pluviales. Estas evaluaciones Permitir que la Autoridad del Río y sus socios monitoreen las tendencias e identifiquen áreas de mejora y preocupación.
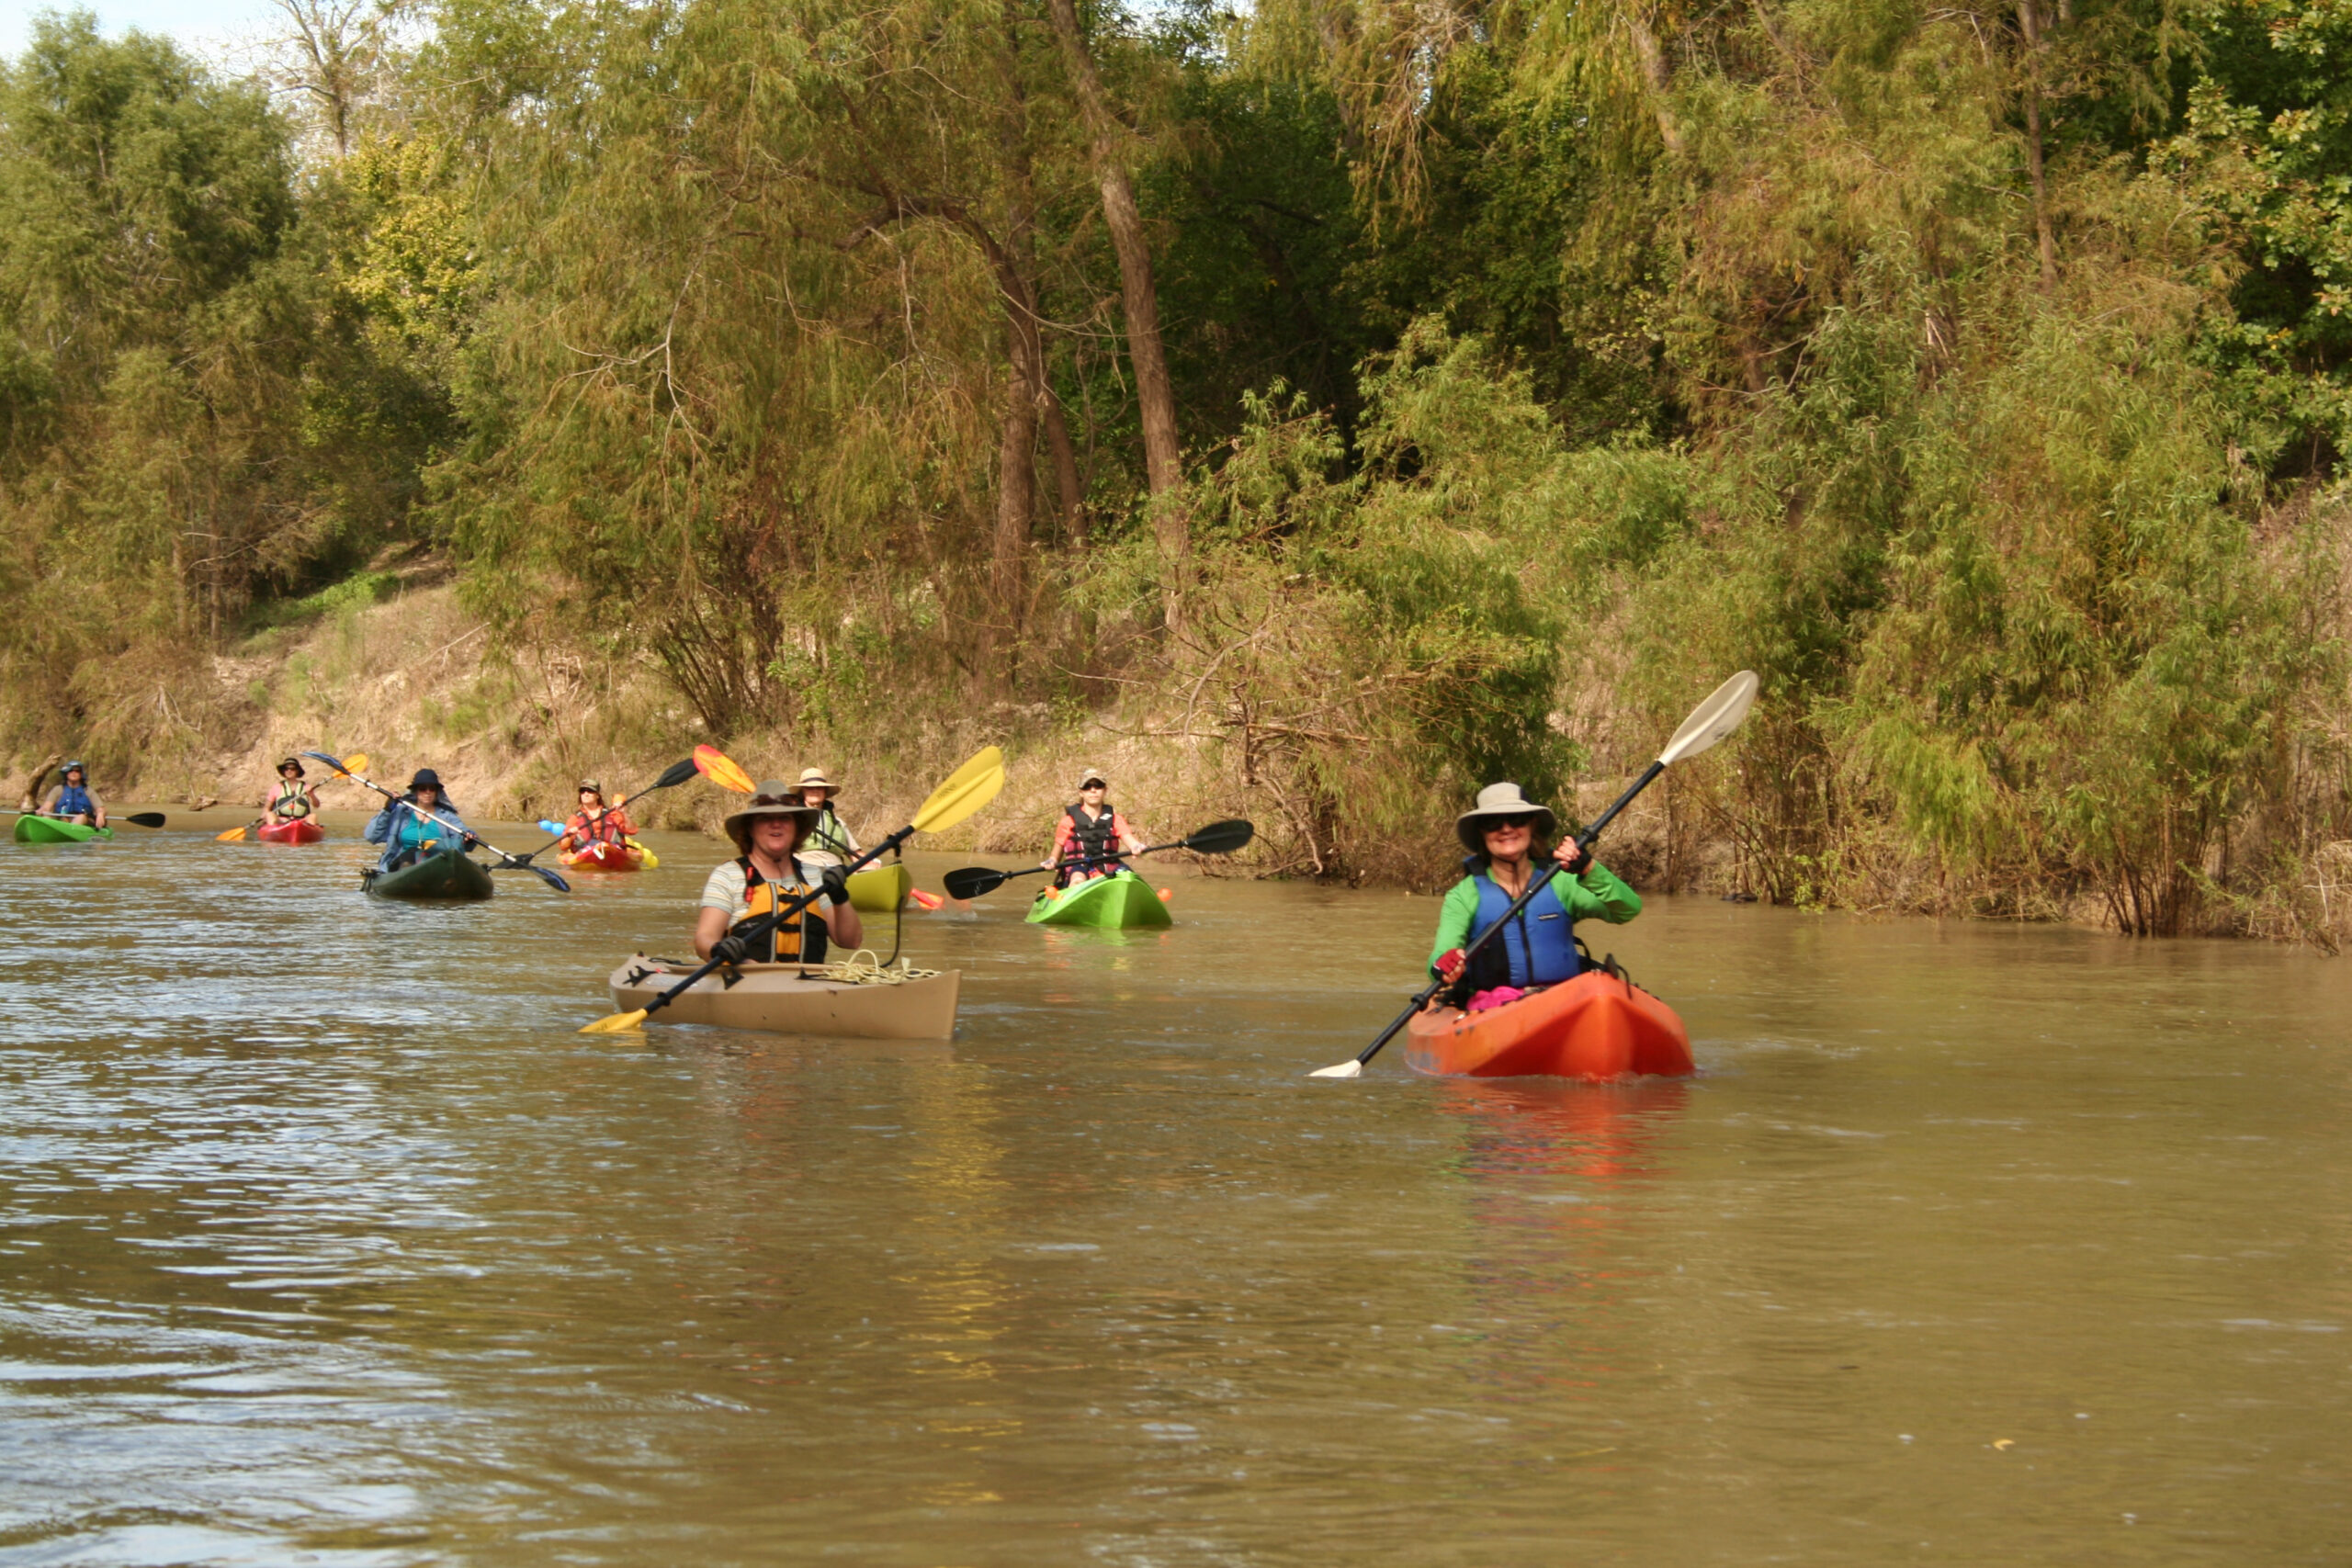
- Usabilidad de recreación de contacto: Para mejorar el disfrute de nuestros ríos, los científicos monitorear los niveles de bacterias en puntos clave a lo largo del río San Antonio y determinar si los niveles cumplen con los estándares adecuados para actividades que representan un riesgo menos significativo de ingestión de agua, como kayak y remo.
Lo bueno es que la mayoría de estos datos están disponibles para el público a través de varias plataformas en ¡nuestra página web!
El Visor de calidad del agua es nuestra plataforma visual interactiva en línea de datos de calidad del agua para más de 250 estaciones de monitoreo en toda la cuenca. Contiene más de 400.000 resultados de seguimiento de eventos que se remontan a 1998. Por ejemplo, el Parque Cultural San Pedro Creek sitio de monitoreo tiene casi 900 E. coli resultados. Lea el blog anterior, "La vida de una muestra de aguas pluviales: Parte 2" para aprender que E. coli es y por qué rastrearlo es crucial!
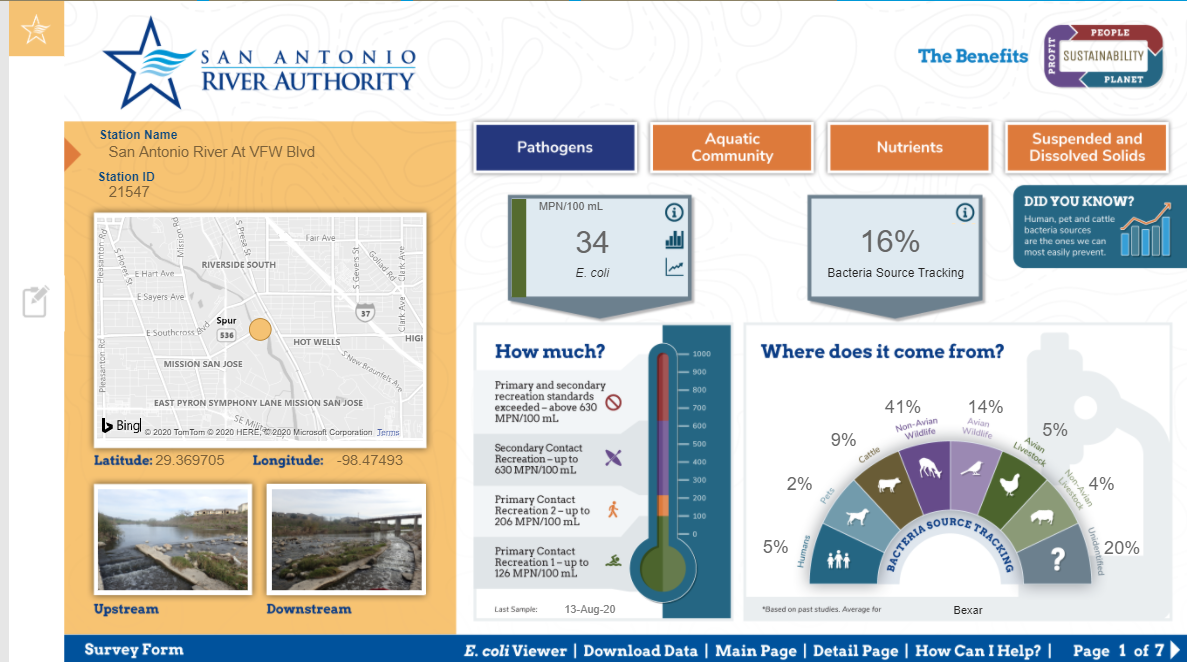
En este visor, las estaciones de monitoreo se identifican en un mapa. Luego, los usuarios pueden ampliar un área de interés o seleccionar estaciones por condado o cuenca. Datos de calidad del agua para patógenos (es decir, E. coli), comunidades acuáticas, nutrientes (p. ej., nitrógeno y fósforo) y sólidos se presentan para cada estación. Los resultados más recientes se muestran y evalúan según las métricas de calidad del agua con una explicación del parámetro y los impactos en la calidad del agua y la vida acuática. También hay gráficos disponibles de los últimos 10 años, 5 años y 1 año de datos. Los resultados están disponibles para descargar por condado, cuenca o estación.
Otra herramienta interactiva disponible en nuestro sitio web es la Panel de bacterias. Este panel muestra la media geométrica de E. coli resultados de bacterias para estaciones de monitoreo con suficientes datos de recolección en los últimos cinco años. ¿Qué es una media geométrica? Una media geométrica es un promedio que multiplica todos los valores de un conjunto de datos y encuentra la raíz del número. Puede ayudar a determinar las tendencias en conjuntos de datos que tienen grandes fluctuaciones, como los niveles de bacterias. Cada estación está codificada por colores para indicar que cumple con los estándares de recreación de contacto primarios (piense en nadar y vadear) o secundarios (piense en kayak y remo).
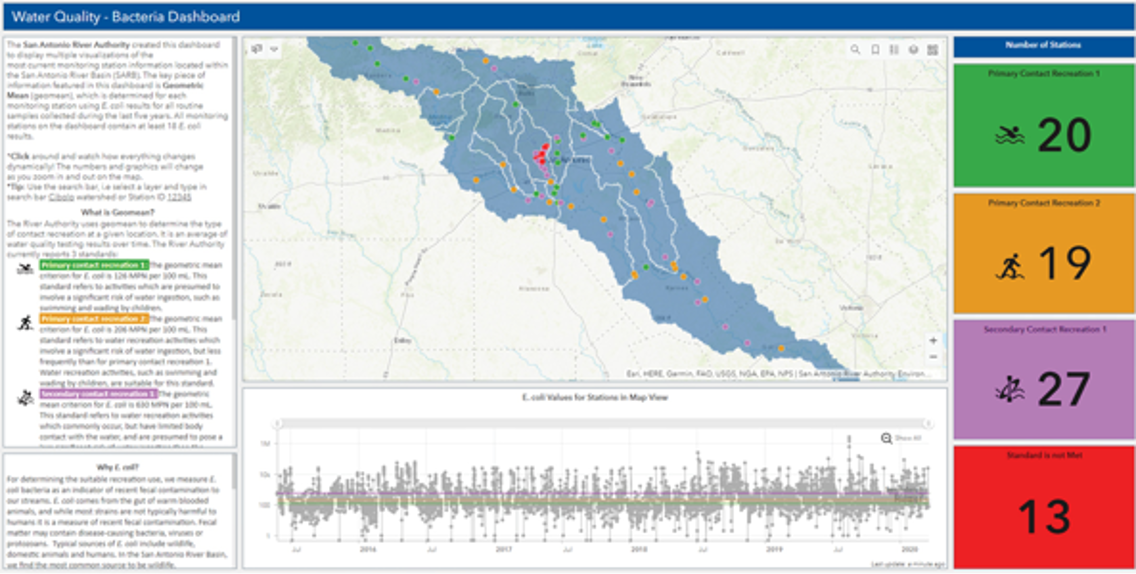
Estos datos resultan útiles para las personas que desean comprobar el nivel de E. coli antes de recrearse en el río. Los usuarios pueden evaluar rápidamente los niveles de bacterias de 5 años en toda la cuenca. Los usuarios también pueden comparar las medias geométricas con las último Informe Integrado de Texas, que no incluye datos de al menos los dos años más recientes, para ver si las condiciones han cambiado debido a la actividad reciente (construcción, características de tratamiento de agua, etc.) que ocurre dentro del cuerpo de agua.
Actual E. coli Los niveles en puntos clave de nuestra cuenca también se pueden encontrar en nuestro Página web de Condiciones Vigentes y Cierres. Aquí, los usuarios pueden ver el nivel de bacterias más reciente en 8 estaciones de monitoreo a lo largo de nuestros senderos para remar y áreas para actividades recreativas. E. coli Se grafican los valores para cada estación, junto con el flujo de corriente y los valores de precipitación diaria. Las muestras en estos sitios se recolectan semanalmente, generalmente los miércoles. Se muestran en la página web al final de la semana, ¡justo a tiempo para los guerreros del fin de semana! La página web también permite a los usuarios ver el historial de la estación y descargar datos si es necesario.
Esperamos que este blog te haya inspirado a navegar por nuestro herramientas de datos de calidad del agua y conozca más sobre las condiciones de calidad del agua de nuestra cuenca y sus áreas de interés. Como siempre, el equipo de ESD agradece comentarios y sugerencias. Si tiene preguntas o comentarios sobre estas herramientas, por favor Contáctenos!